Standard reports
Six ready-made views of hours, spend, utilization, project burn, compliance, and leave balances.
Standard reports answer the questions you ask most, with no setup. Each one reads from the time your team already logs, so opening Reports is enough to see who logged what, and where spend, utilization, compliance, and leave balances are heading. They're on every plan.
What each report shows
Open any card on the Standard Reports tab to drill into the full report.
Hours by Member
How many hours each person put on each charge code between two dates. One row per member and charge code, with a total, so you can reconcile payroll, back up an invoice, or hand a labor distribution to an auditor without building anything.
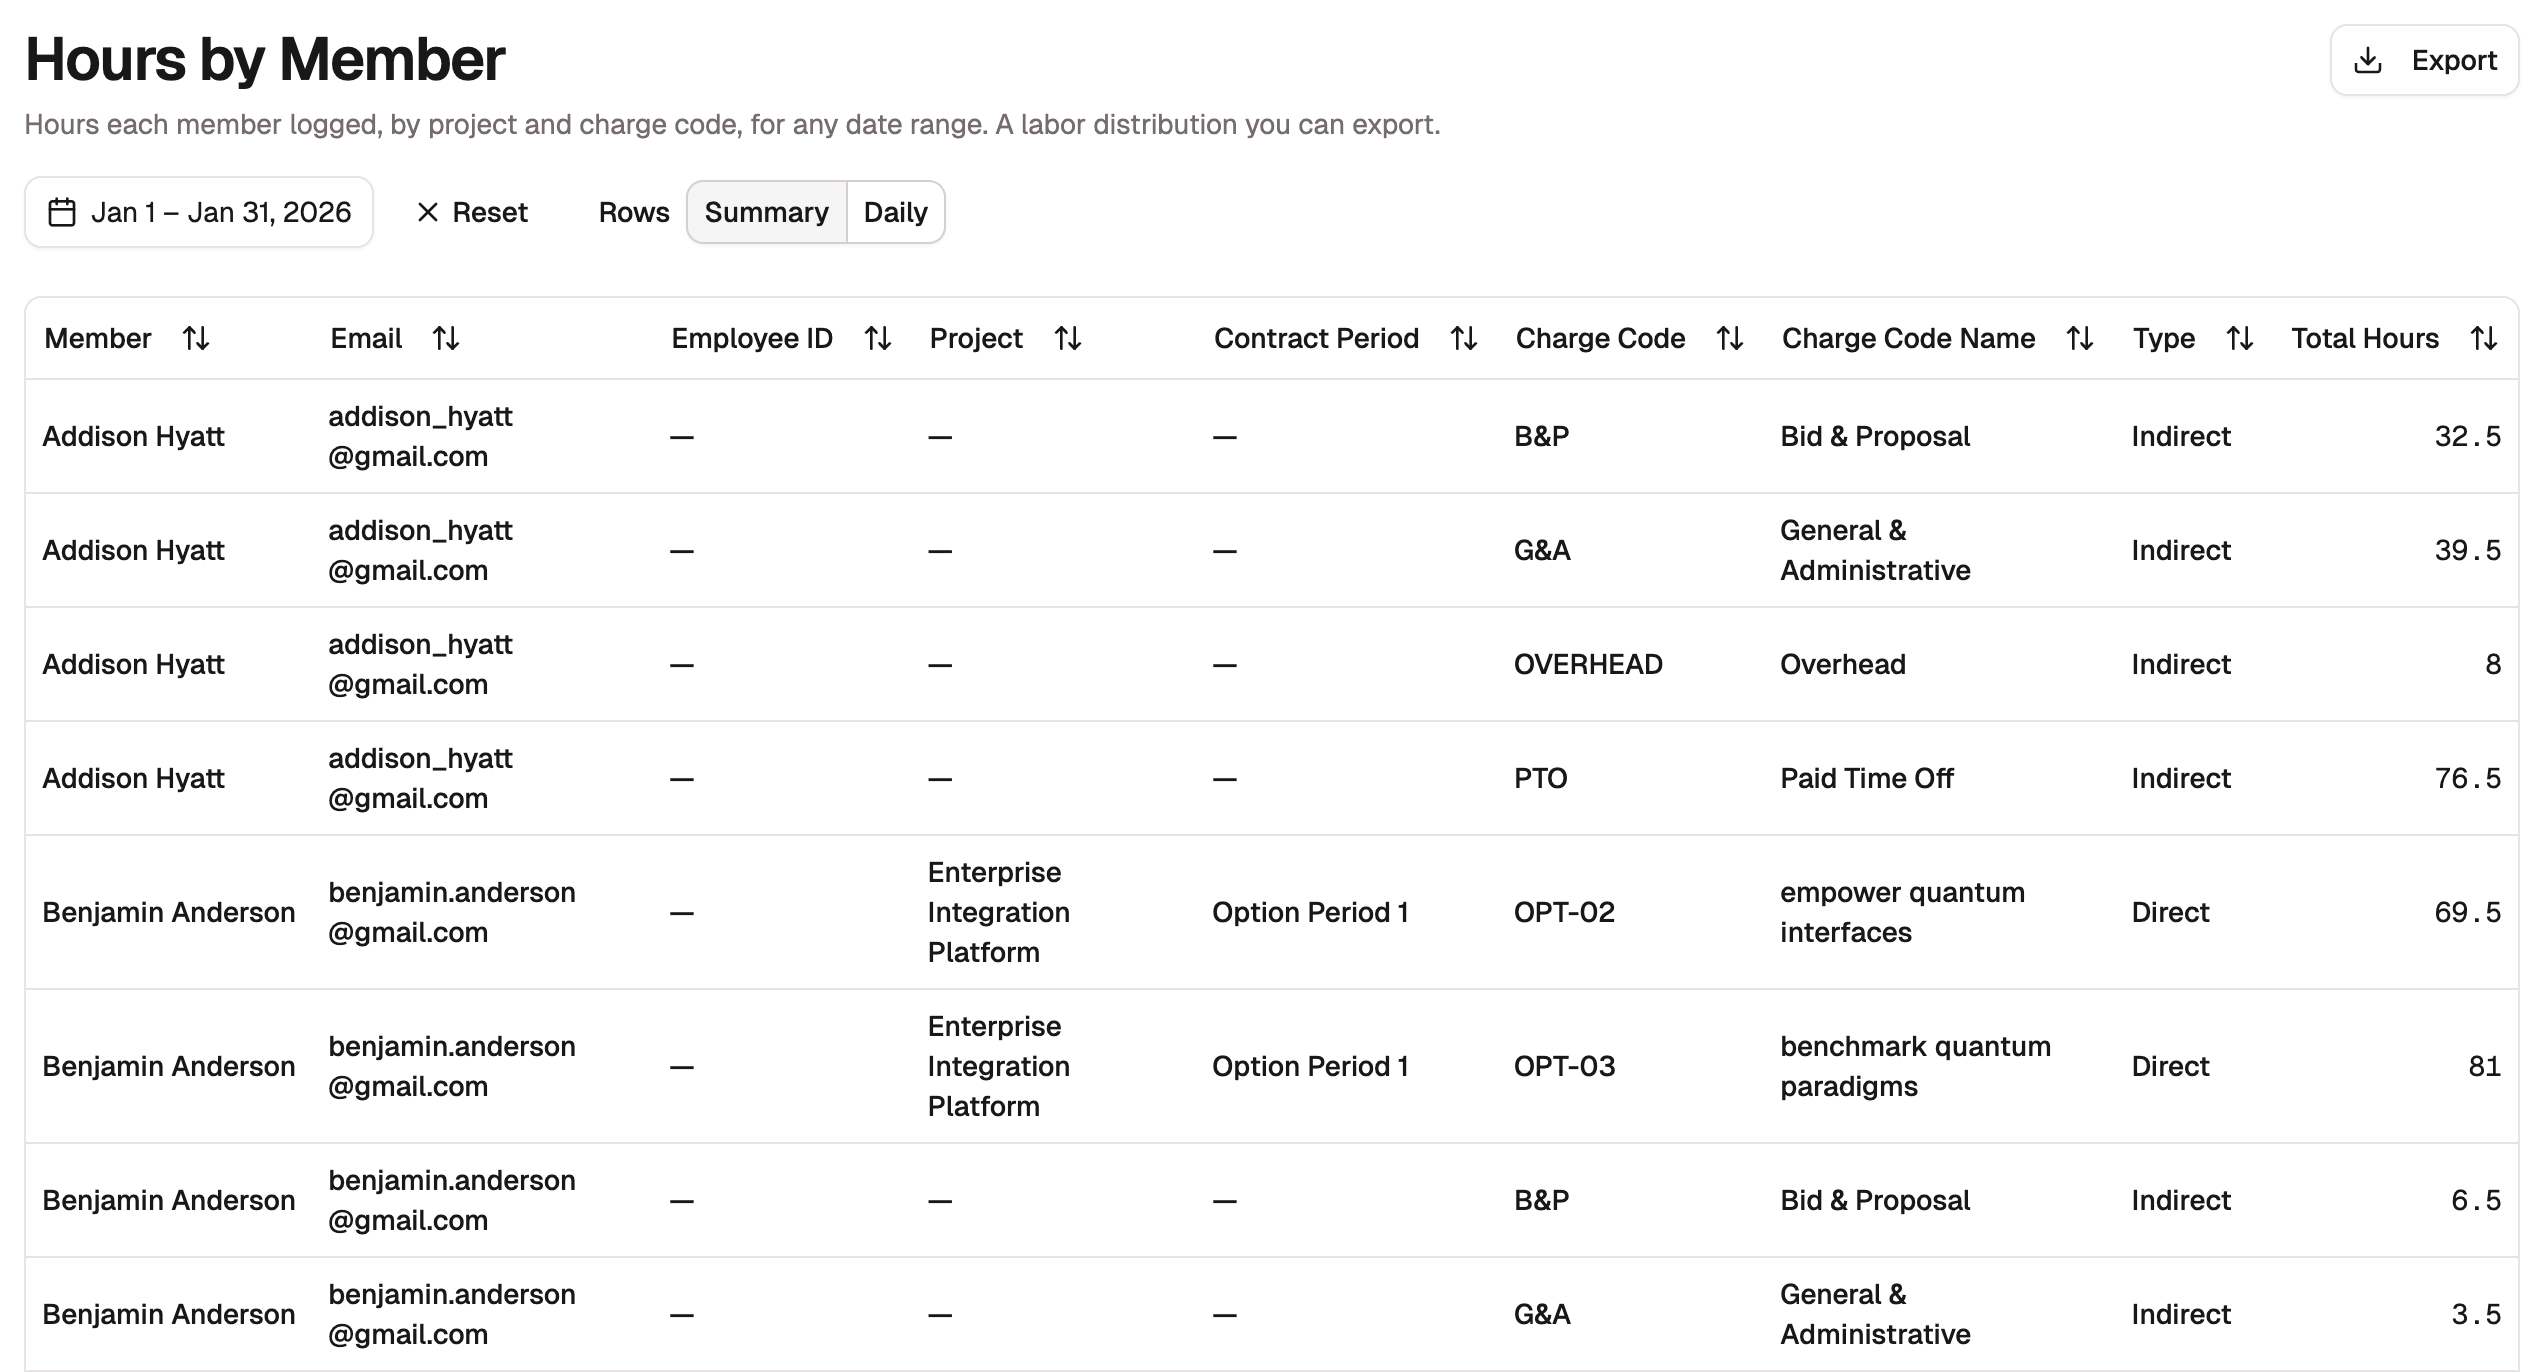
The report opens on the previous calendar month, the newest range likely to be fully approved. Choose any other range from the header. The Rows control beside it picks the grain:
- Summary gives one row per member and charge code over the whole range.
- Daily splits those rows by calendar day and adds a Date column. It covers ranges of up to 92 days. Over a longer range the report keeps your range and shows summary rows, and says so beside the control.
Each row carries the member's Email and Employee ID for matching against your payroll system, and the charge code's Project, Contract Period, Charge Code Name, and Type (Direct or Indirect). Contract period is its own column because the same code text can exist in two periods of one project, and those are two rows, not one: they bill separately. Select any column header to sort. The Total row sums the hours shown.
A few rows are kept on purpose, so the total ties out to what was logged:
- A member who has left the organization is labeled (archived).
- A member you pre-provisioned but who hasn't joined yet is included, since you can enter time for them.
- Hours on a charge code that was later deleted stay on the member's total as a Deleted charge code row.
- Hours are signed, so a giveback on a leave code reads as a negative figure, the same way the timesheet shows it.
Which timesheets count follows the review-aware rule: an open cycle, or one whose cycle review isn't closed, counts hours at every status. Once a cycle review is closed, only approved hours count, and the report notes any it left out.
The CSV and Excel export follow what the table shows, including the row grain. For filters, your own column layout, or a saved and scheduled version, build a table report instead; the link under the table takes you there.
Spend summary
How much you've approved against what's funded. A bar chart pairs approved spend with remaining funding for each period your work bills against, and the table below breaks out Spend, Funded, and Remaining per Contract Period.
Utilization
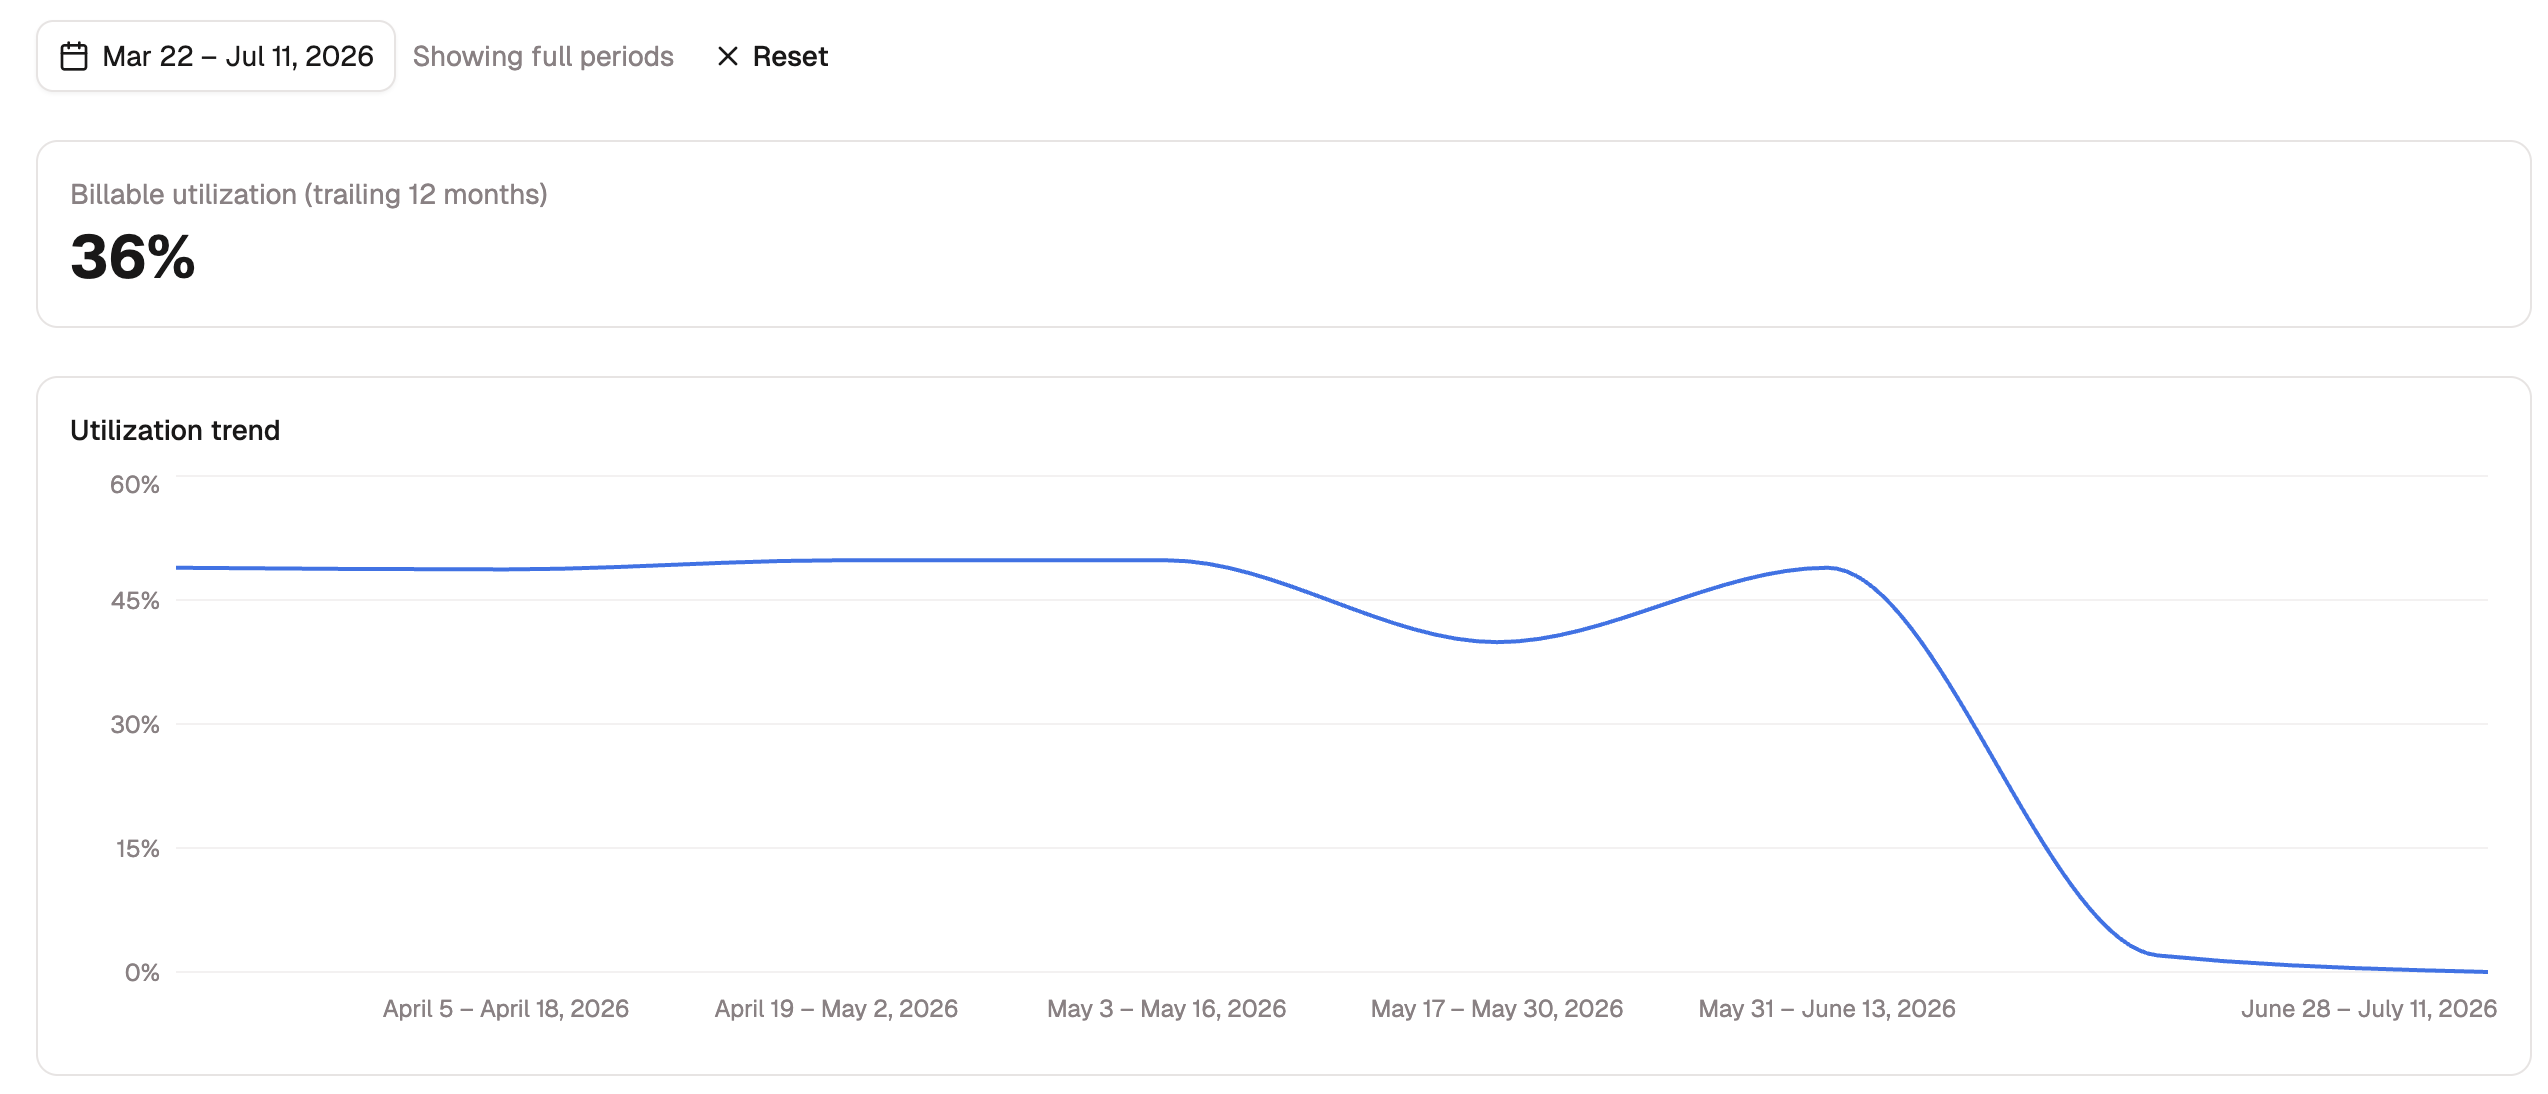
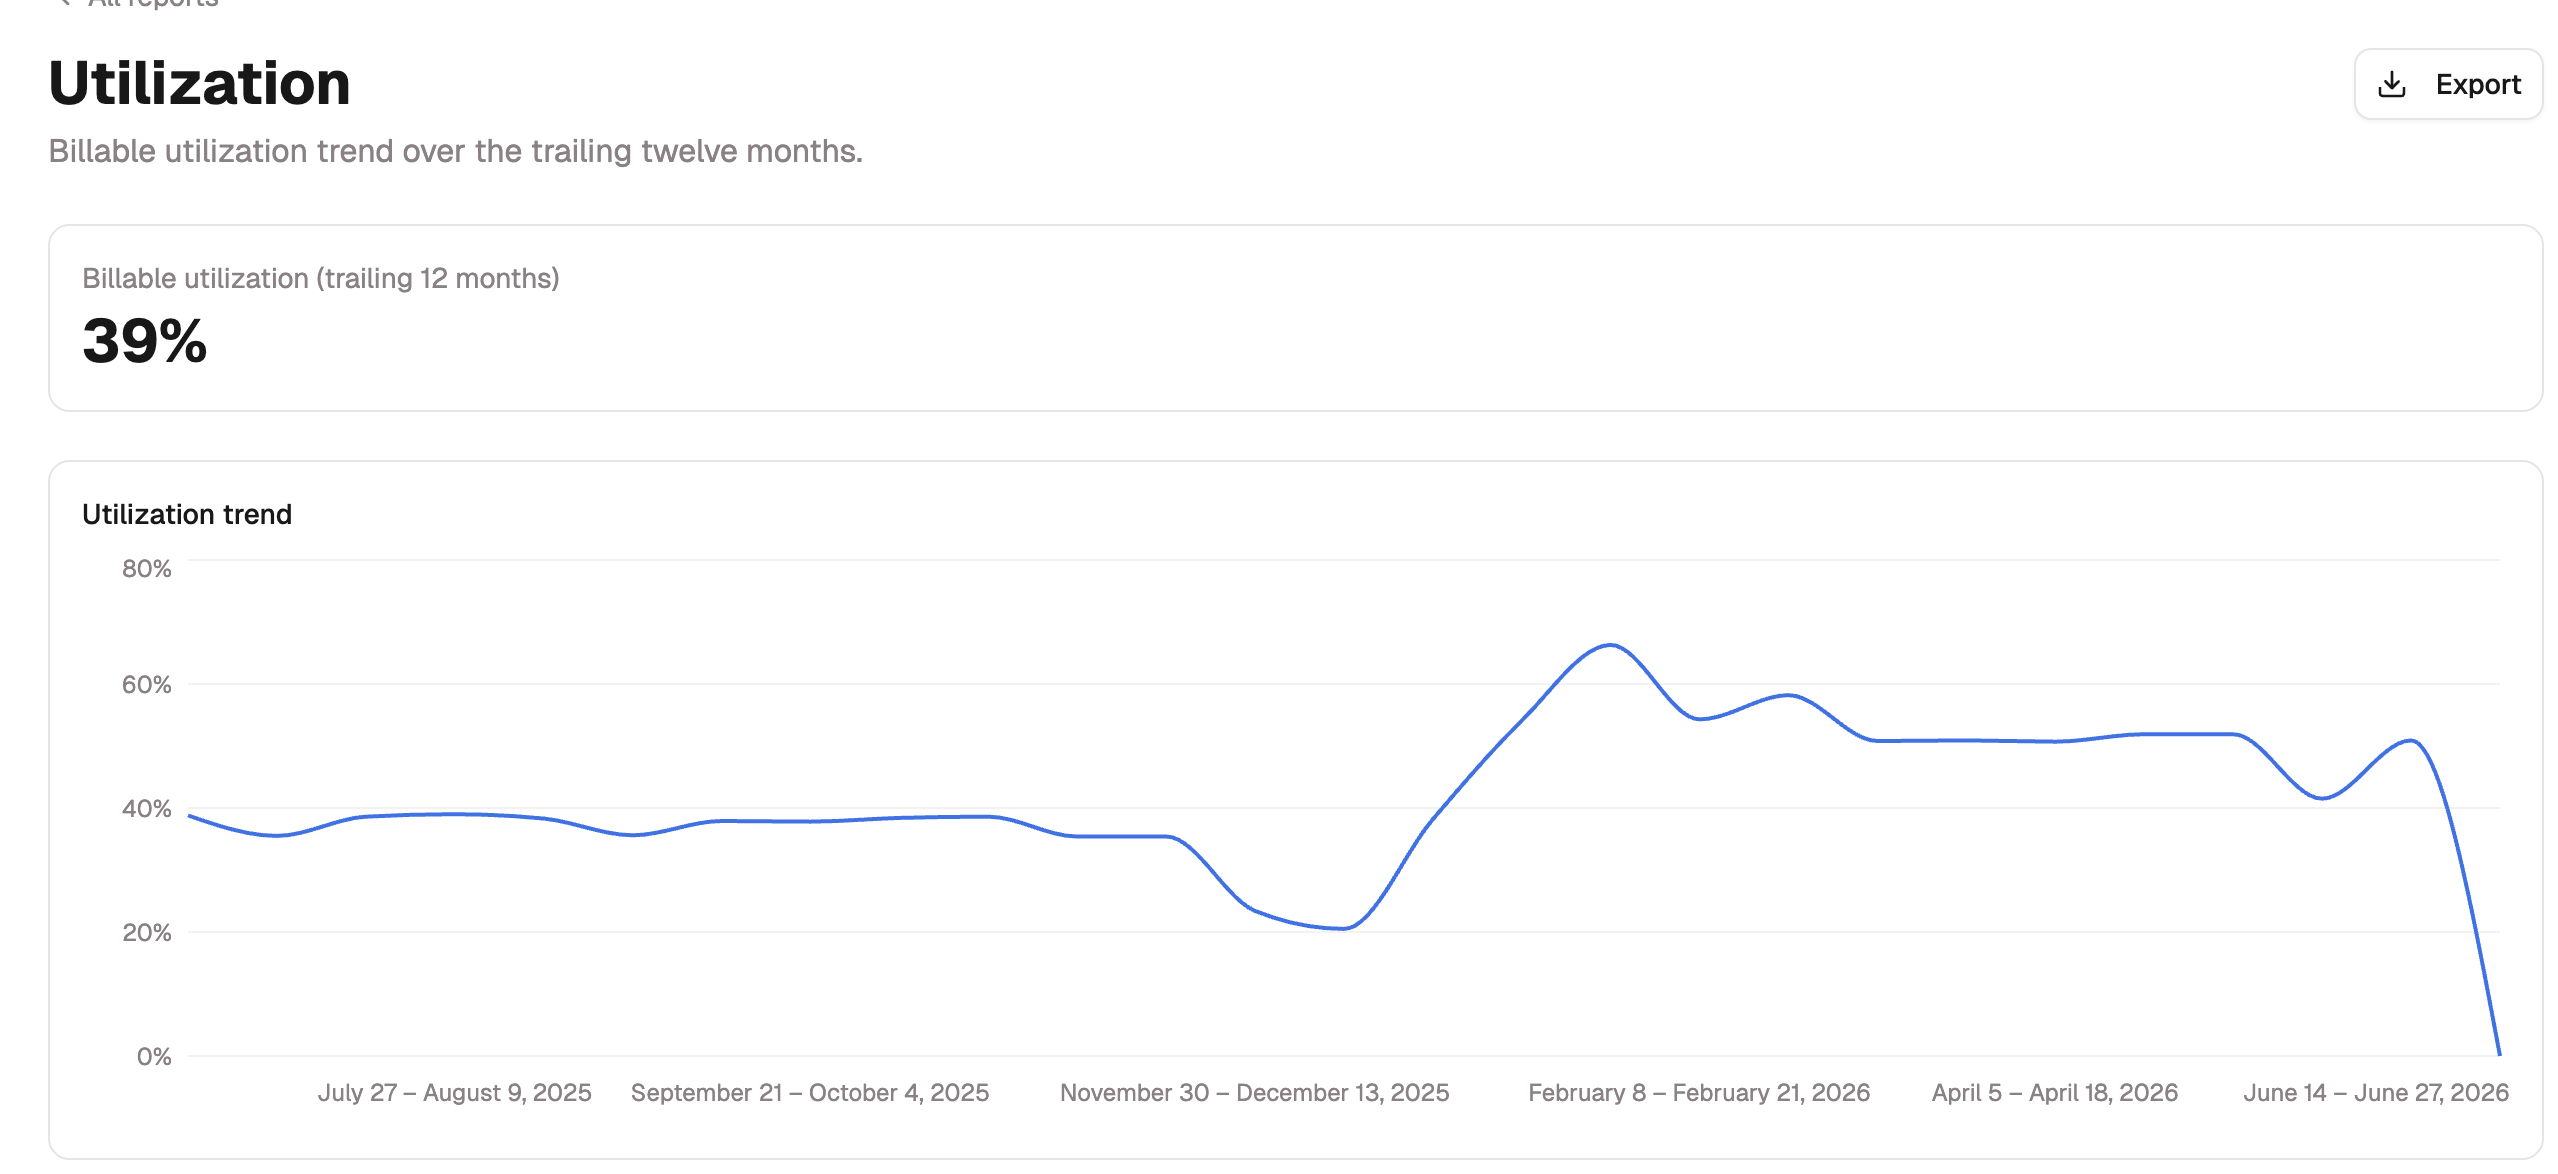
How billable your team has been. A line tracks billable utilization across the trailing twelve months, with a tile calling out the current period, so you can see the trend and where it stands today.
Project burn
How fast funding is being consumed. Each funded project gets a card with a progress bar for funding spent, the funded amount, how much of its time window has elapsed, and a pace indicator that flags whether spend is ahead of or behind schedule. For how each period's funding is recorded and tracked, see Funding and burn.
Project burn doesn't take a date range. It always shows each funded project's full period of performance, which keeps its remaining balance and pace accurate.
Timesheet compliance
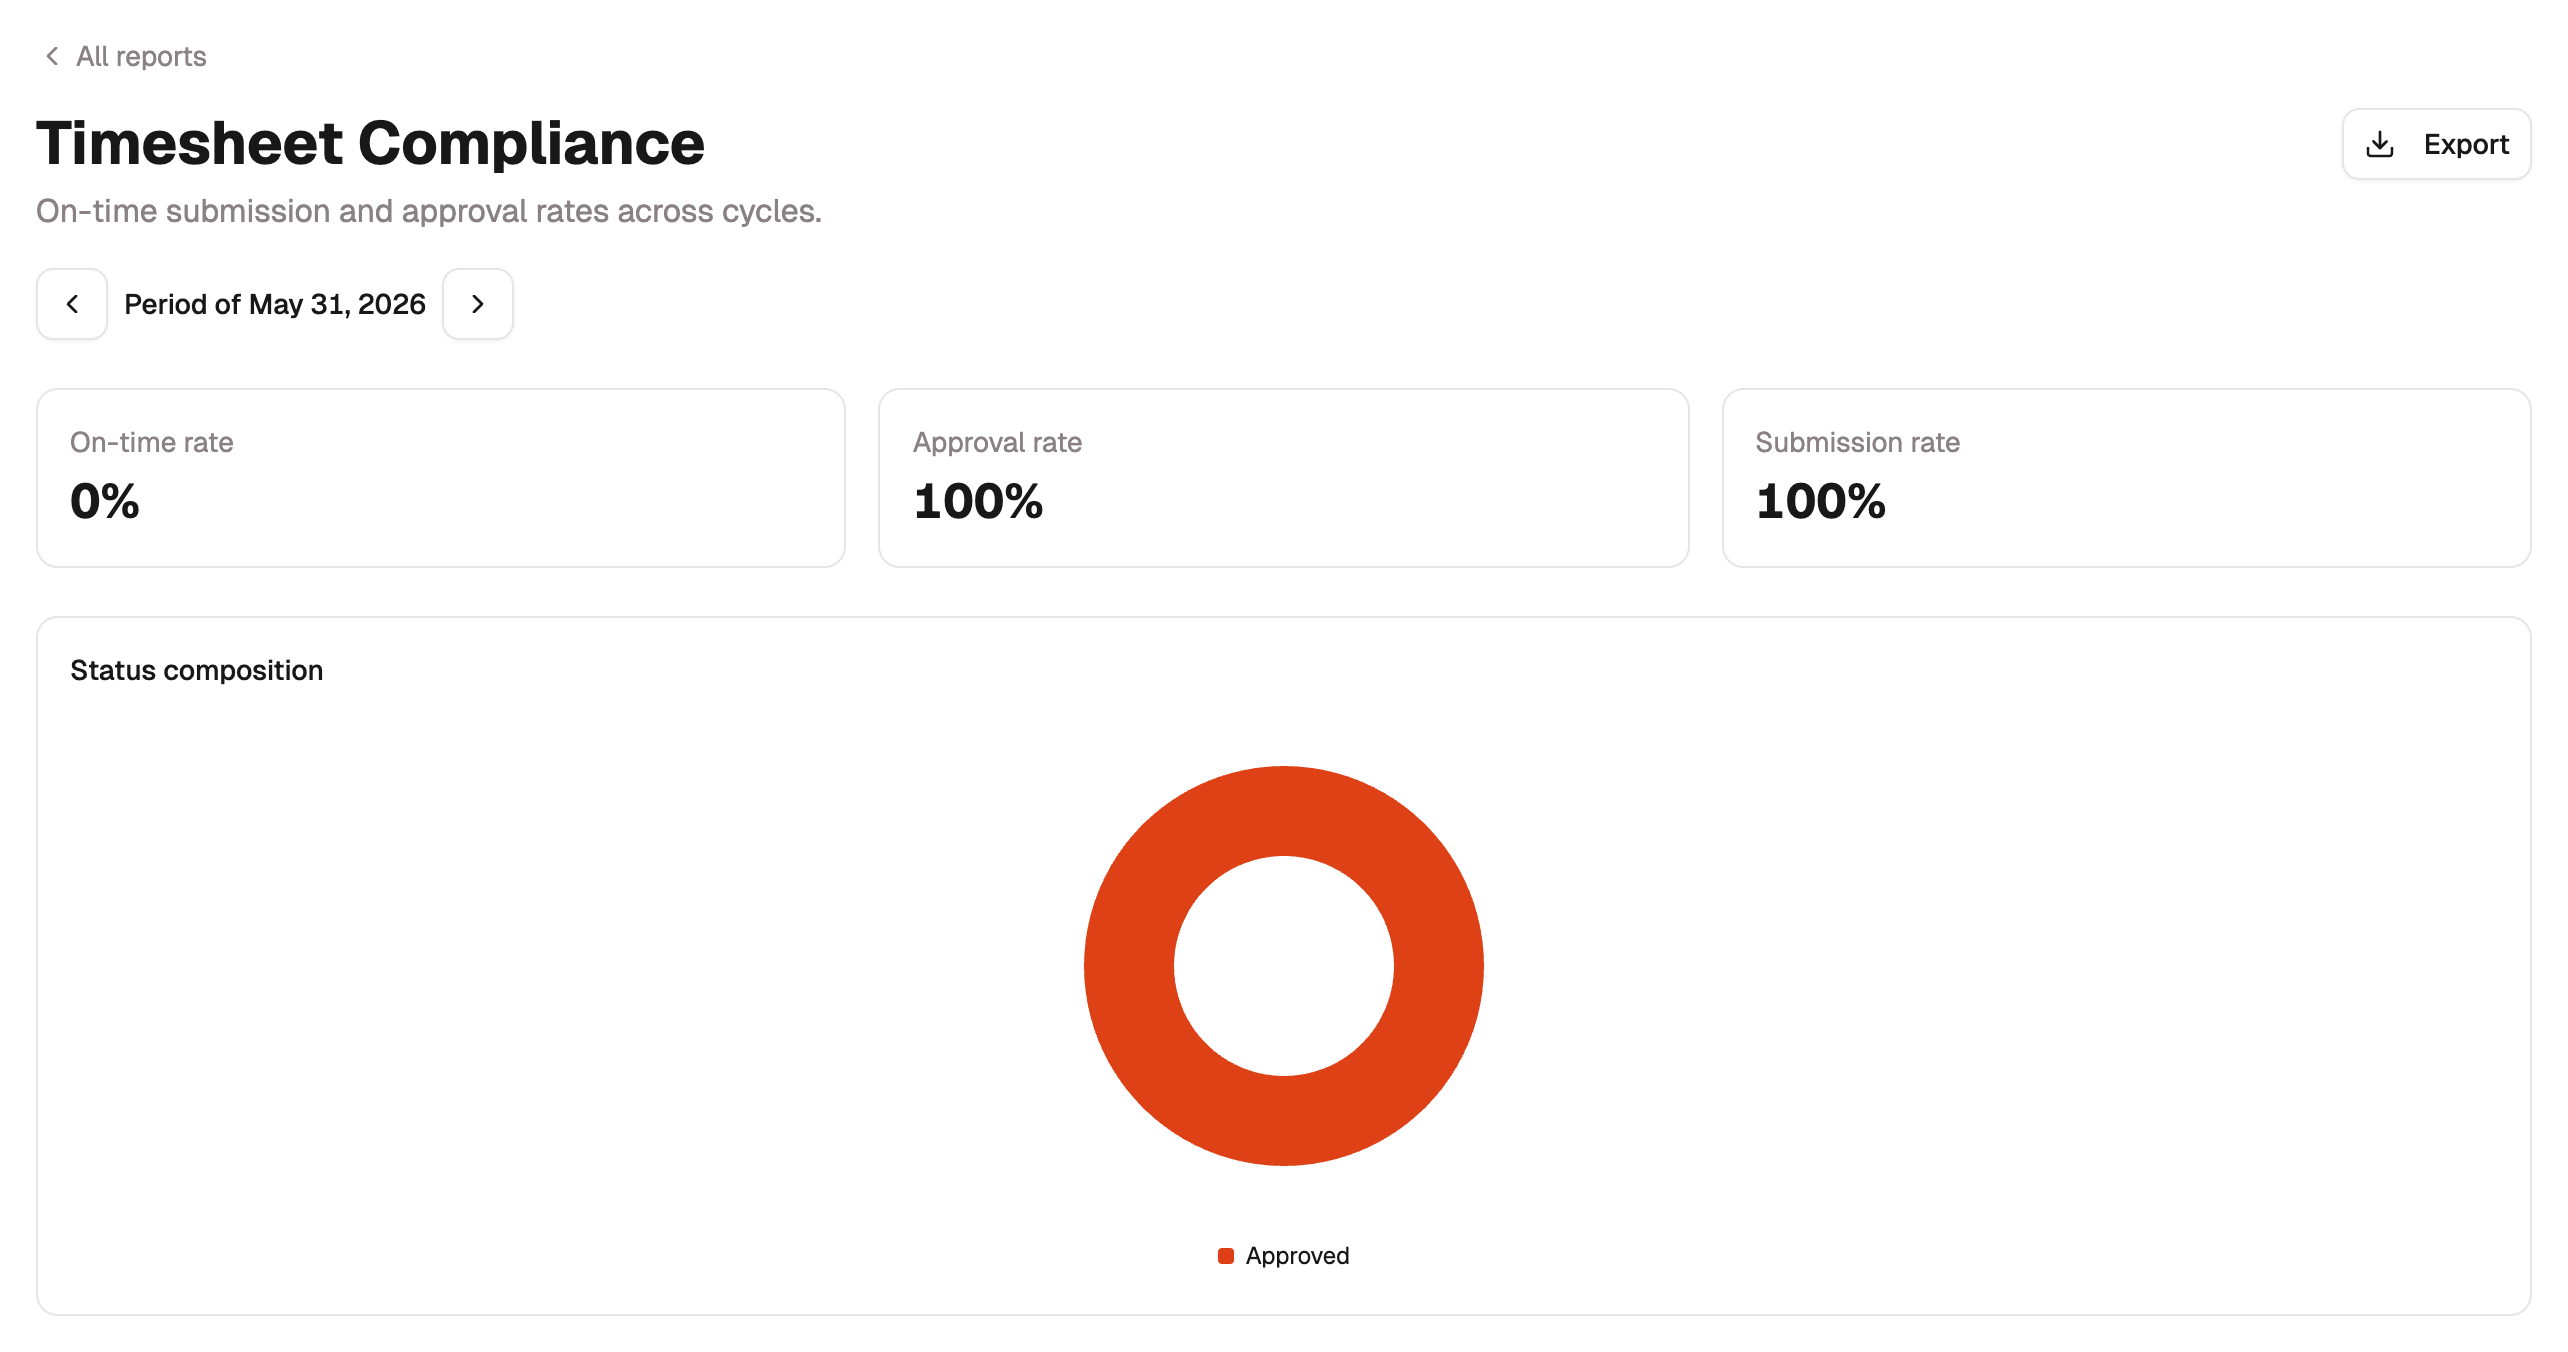
Whether timesheets land on time. Tiles surface on-time submission, approval, and submission rates, and a donut shows the status mix across recent cycles, so you can spot a slipping team before a period closes.
Leave balance roll-forward
Where every leave balance stood at the start of a date range, what moved during it, and where it stood at the end. One row per member and leave bank, so the closing figure can be tied out to payroll when you close a month.
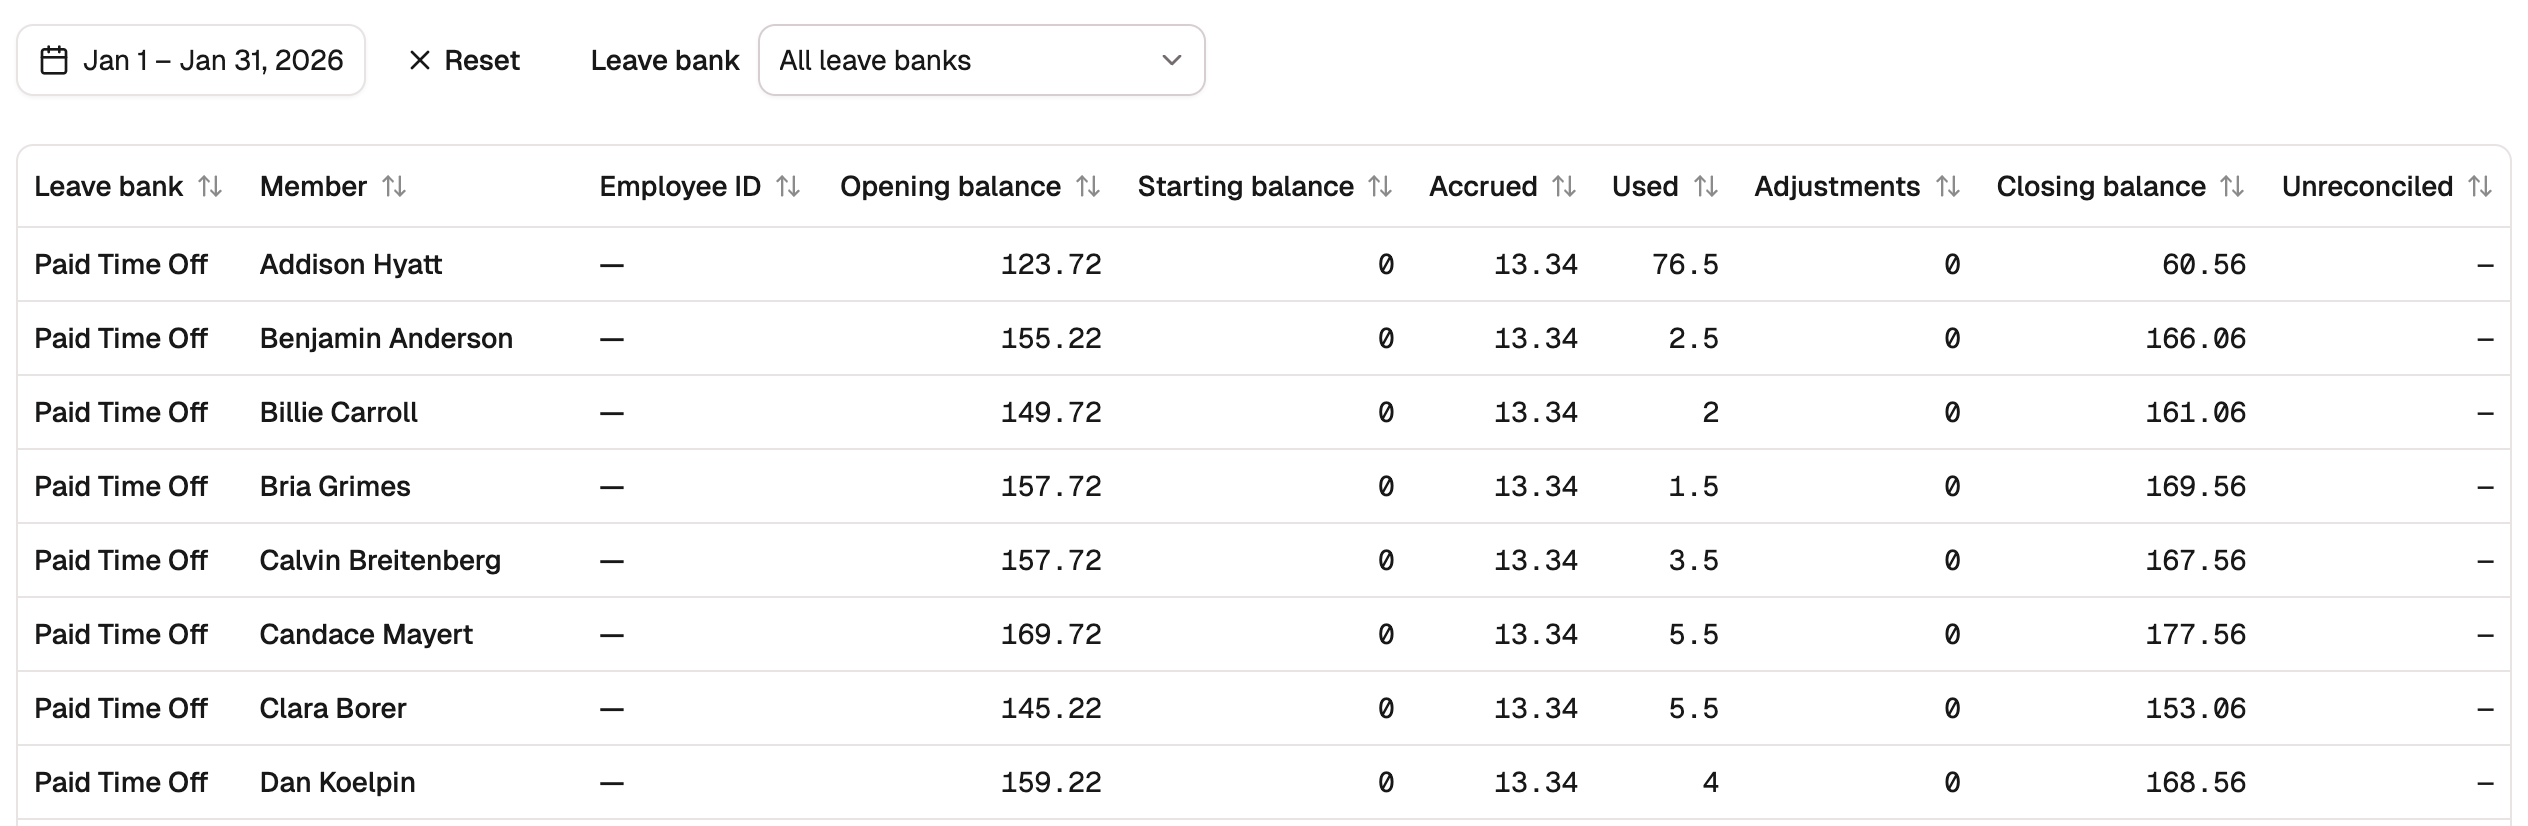
The report opens on the previous calendar month, which is the month you're most likely closing. Choose any other range from the header. The Leave bank select beside it narrows the table to one bank. Leave it on All leave banks to see every bank at once. The choice is part of the page URL, so a filtered report is a link you can share.
Each row reads left to right:
| Column | What it shows |
|---|---|
| Opening balance | The official balance on the day before the range starts. |
| Starting balance | Balances you set by hand inside the range, kept apart from adjustments. |
| Accrued | Hours the bank accrued inside the range. |
| Used | Hours spent from the bank inside the range. A net giveback reads as hours given back. |
| Adjustments | Manual adjustments, migrations, and carryovers dated inside the range. |
| Closing balance | The official balance on the last day of the range. |
| Unreconciled | What the closing balance carries beyond the other columns: the closing balance, minus the opening balance plus starting balance, accruals, and adjustments, less usage. A row that foots shows a dash. |
A dash in a balance column means no official balance existed at that end. A dash never stands in for zero, because zero is a real balance. A member who left mid-range still appears, labeled as archived, so their bank ties out too. The Total row sums the rows shown; with a bank selected, it describes that bank alone.
When Unreconciled isn't zero
The report shows drift instead of hiding it. A non-zero figure means an approval or adjustment attested a balance that the ledger rows in this range don't explain, or that no balance was attested inside the range, so the closing figure fell back to an older checkpoint. Open that member's PTO ledger and narrow it to the bank to see which rows account for the difference.
Need totals by charge code or yearly leave totals?
Those come from custom reports. For hours totaled per charge code rather than per member, build a chart report on the Charge code hours feed, or a table report for the raw rows. For a single calendar year's accrued and used leave per member, build a chart report on the Member leave balances feed. The roll-forward above covers balances over any date range.
Scoping and exporting
Set a report's time window from its own header. Step through periods or years with the arrows, or select Choose date range for an exact span (Project burn is the exception, staying on its full period of performance). Hours by Member and Leave balance roll-forward work in calendar days rather than periods, so a range there covers exactly the days you choose. Then export to CSV or Excel from the same header. See Reports overview for how each control works.