
Custom reports
Build your own report, as a chart or a table, when a standard one doesn't fit.
When a standard report doesn't answer your exact question, build your own. A custom report takes one of two shapes, and you choose which when you create it:
- A chart report visualizes a trend or comparison, with an optional companion table.
- A table report is a fully customizable export you assemble column by column.
This page covers chart reports. Table reports use a different builder, the Export Builder, with its own page: Table reports.
Custom reports are a Plus feature. On Starter or the free tier, the Custom Reports tab shows an upgrade panel instead. Select View plans to compare plans.
Start a custom report
- Open Reports and select the Custom Reports tab.
- Select Create a new report, the dashed tile at the end of the grid.
- Choose Chart report or Table report.
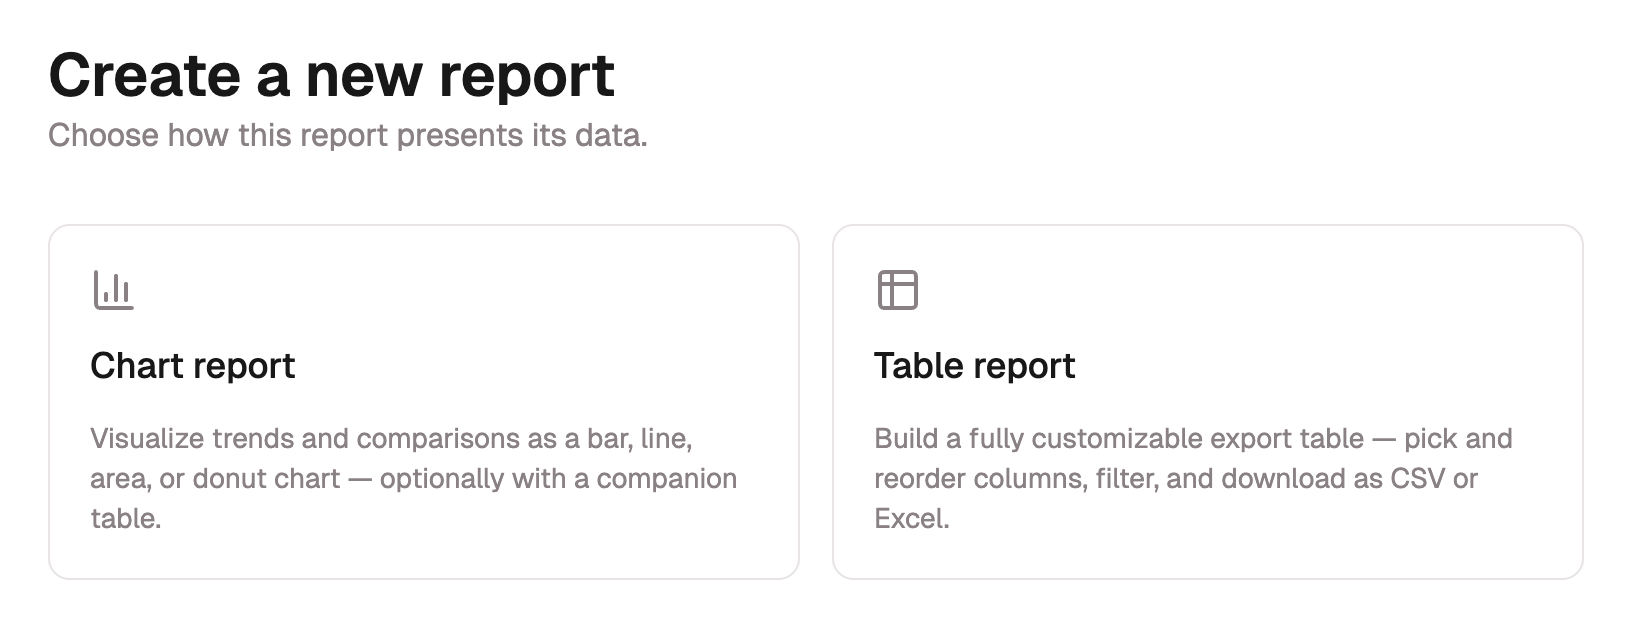
Choosing Table report opens the Export Builder; see Table reports. Choosing Chart report opens the three-step builder below.
Build a chart report
The chart builder walks through three steps: Details, Data feed, and Configure. A progress rail above the form numbers the steps and marks which are done; on a phone it names the step you're on instead.
Name it and choose an output
On the Details step, name the report and add an optional description. Then choose what it outputs:
- Chart: a single bar, line, area, or donut chart.
- Chart and table: the same chart paired with a companion table of the underlying rows.
Choose a data feed
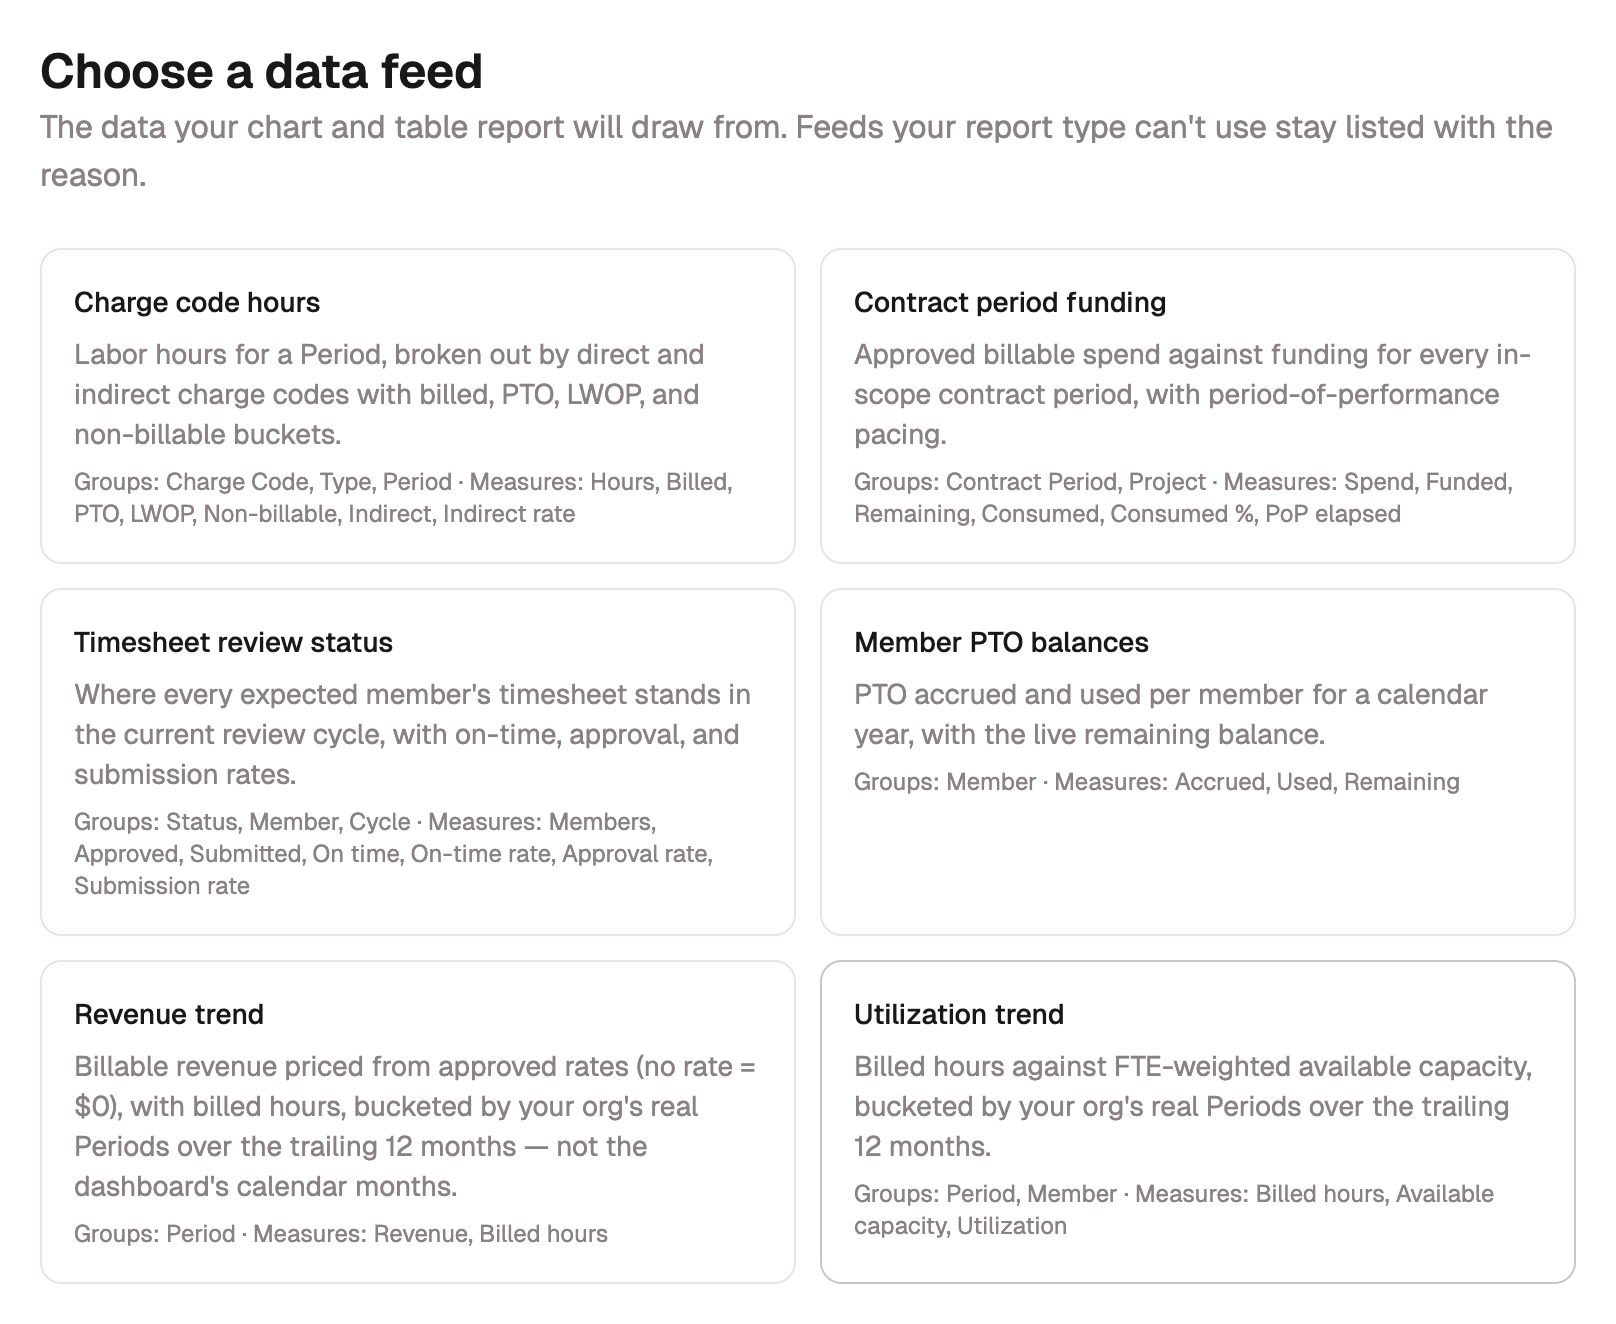
A data feed is the dataset your report reads from. It sets which fields you can group by and which measures you can total. Seven feeds are available:
| Feed | Reports on | Group by | Measures include |
|---|---|---|---|
| Charge code hours | Labor hours per charge code for a period | Charge Code, Type, Period | Hours, Billed, PTO, LWOP, Non-billable |
| Contract period funding | Approved spend against funding per contract period | Contract Period, Project | Spend, Funded, Remaining, Consumed % |
| Timesheet review status | Where timesheets stand in a review cycle | Status, Member, Employee ID, Cycle | On-time, approval, and submission rates |
| Member leave balances | Leave accrued and used per member for a calendar year | Member, Employee ID, Leave bank | Accrued, Used, Remaining |
| Leave balance roll-forward | Official balances at each end of a date range, and the movements between | Leave bank, Member, Employee ID | Opening balance, Accrued, Used, Adjustments, Closing balance, Unreconciled |
| Revenue trend | Billable revenue over the trailing 12 months | Period | Revenue, Billed hours |
| Utilization trend | Billed hours against capacity over 12 months | Period, Member, Employee ID | Billed hours, Available capacity, Utilization |
On Member leave balances, add the Leave bank dimension to split the numbers per bank (PTO, Holiday, and so on) instead of one combined figure per member. The member-level feeds also group by Employee ID, handy when a report feeds payroll.
Configure the view
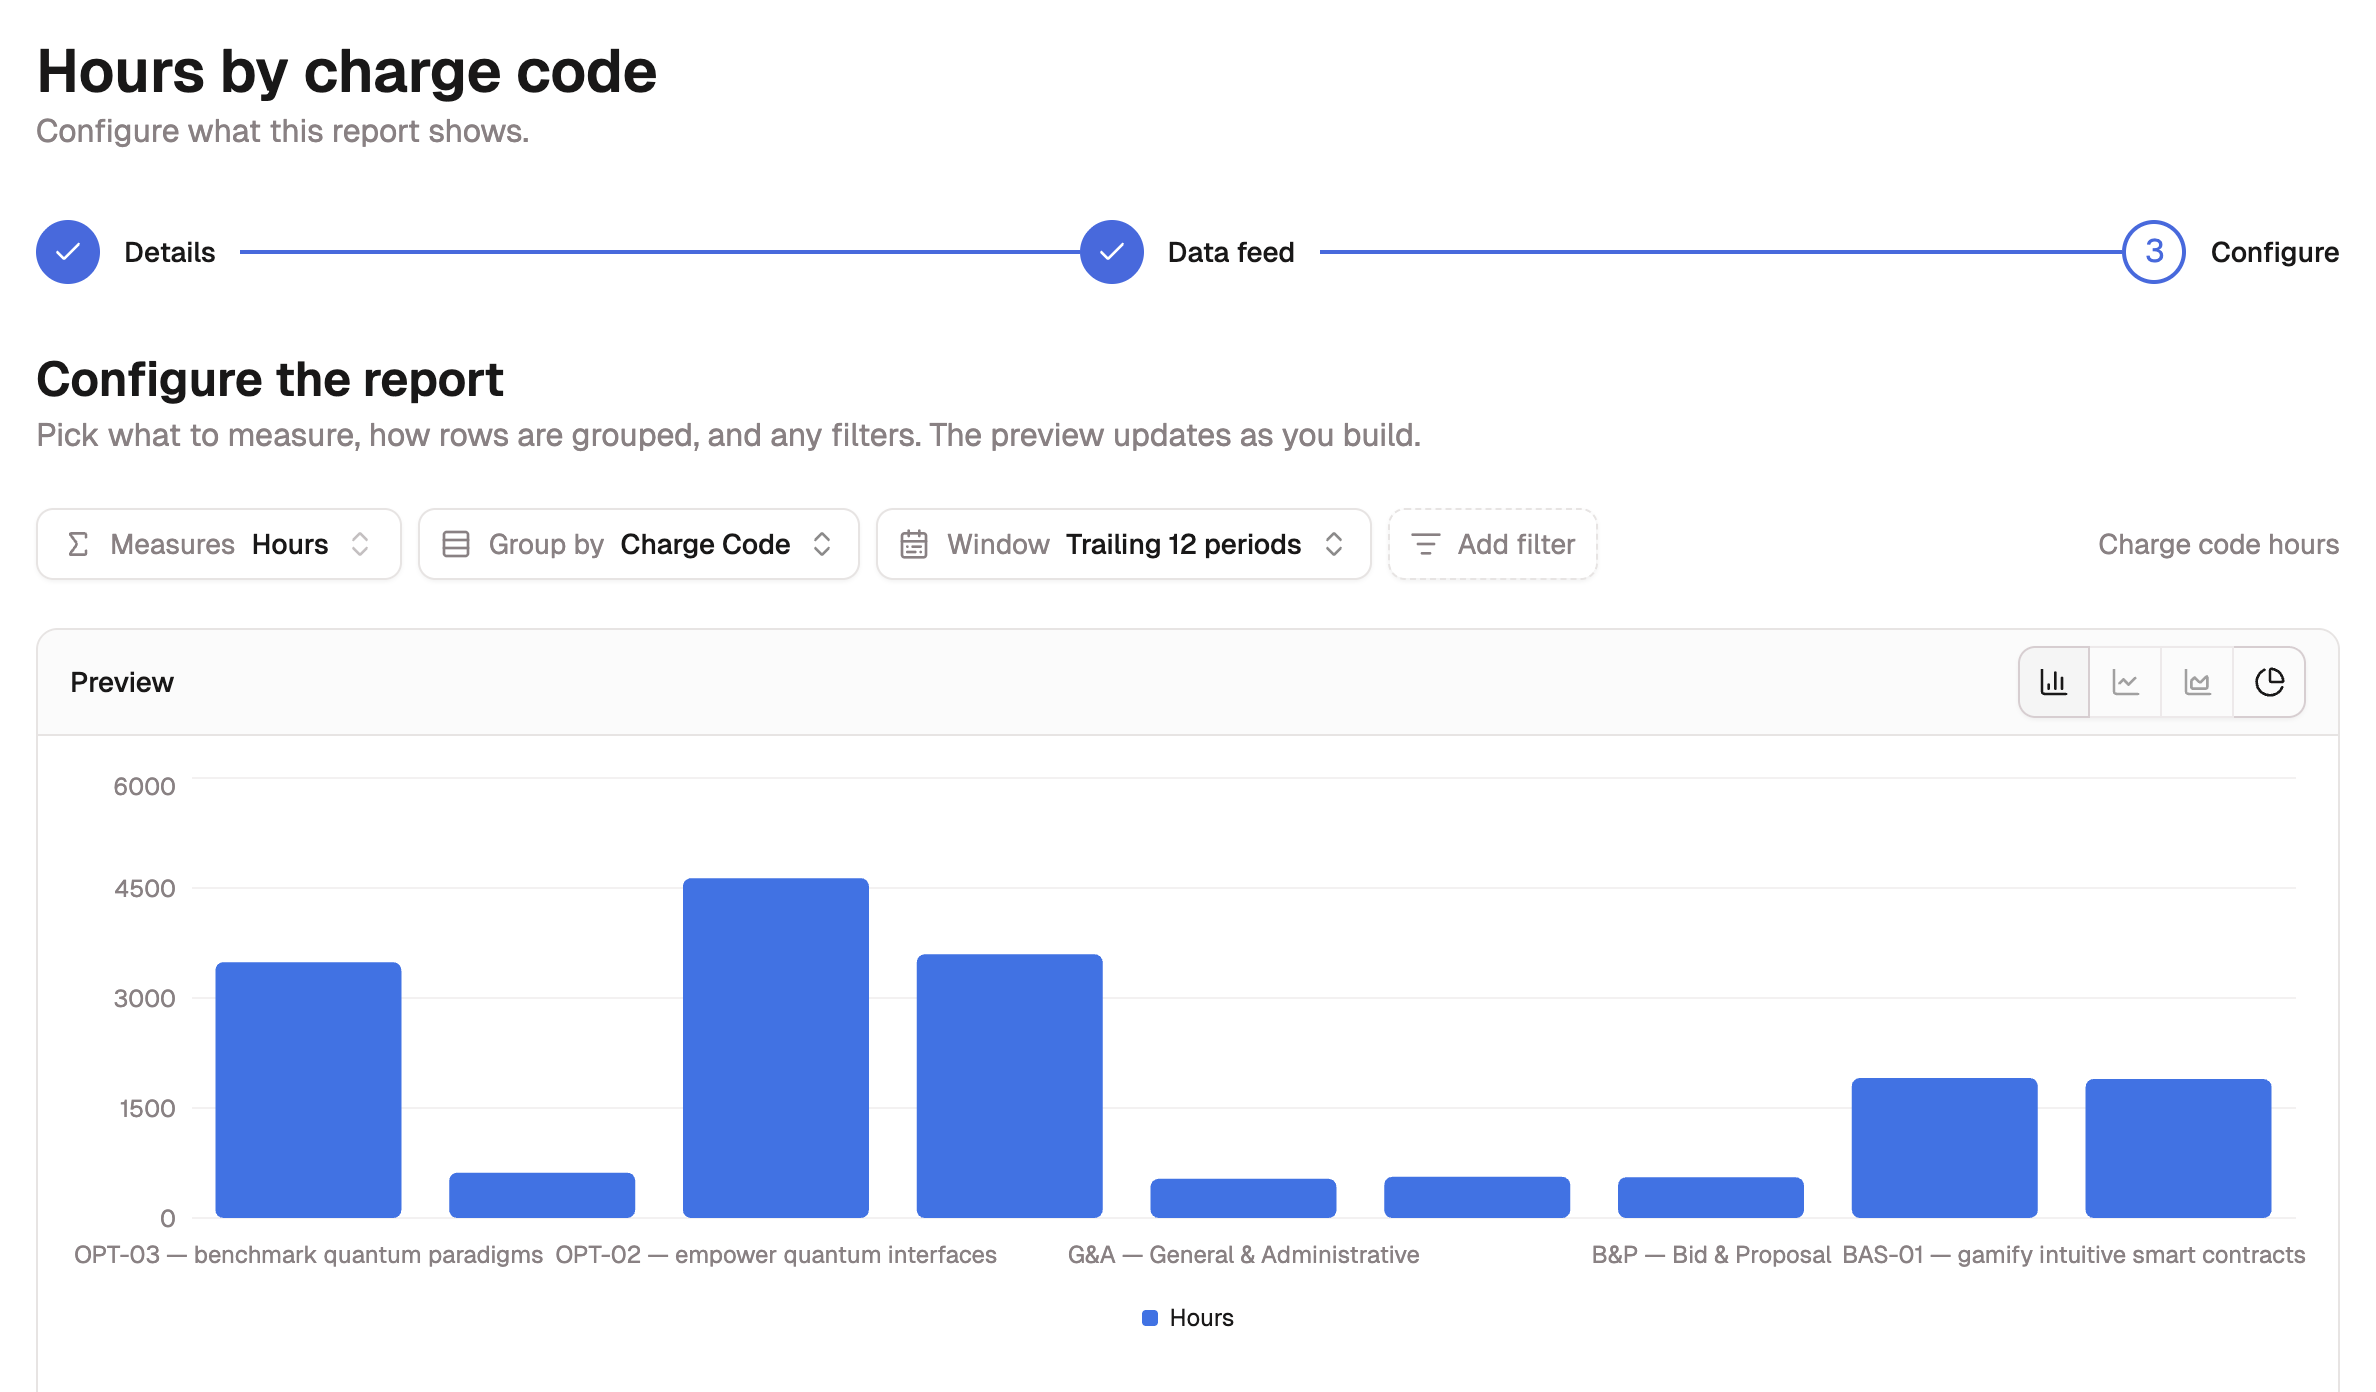
The Configure step is where the report takes shape, with a live preview that updates as you work.
- Measure and group: choose one or more measures to total and a field to group by. Grouping Hours by Charge Code gives one bar per code.
- Set the time window: Charge code hours and Timesheet review status take a trailing window of the last 3, 6, or 12 periods. Those two, plus Revenue trend and Utilization trend, also take an exact date range you set with Choose date range. A trailing window and a range are one choice, so picking either clears the other; see Set a date range. Contract period funding and Member leave balances use a fixed window.
- Filter the rows: select Add filter to narrow what's included, by a field
(is or is not a set of values) or by a measure threshold (
<,≤,≥,>). - Pick a chart family: bar, line, area, or donut. Line and area need a time-based grouping (a Period or Cycle); bar and donut work with any grouping.
Save, revisit, and share
Select Save report when it's ready. The report appears as a card on the Custom Reports tab, shared across your organization, so other admins see it too. Open one any time and its numbers recalculate against current data.
You don't have to finish in one sitting. Saving at the Data feed step keeps a draft, which carries a Draft badge on the Custom Reports tab and reopens at Configure where you left off.
To remove a report, select the trash icon on its card and confirm.
Deleting a report
Deleting a report removes it for everyone in your organization. The underlying time data is untouched, so you can rebuild the report whenever you need it.