
Reports overview
Where your team's spend, utilization, and compliance reports live, and who can open them.
Reports turn the hours your team logs into a picture of the whole organization: who logged what, what you've spent against funding, how billable your people are, and whether timesheets land on time. This page covers where Reports lives, how to scope a report in time, and how to get the numbers out.
Open Reports
Reports is administrator-only. Reviewers and members don't see it, so the org's spend and budget stay with the people who own them.
Find Reports in the management navigation under Setup. You can also open it
directly at /<your-org>/reports (for Acme LLC, that's /acme-llc/reports).
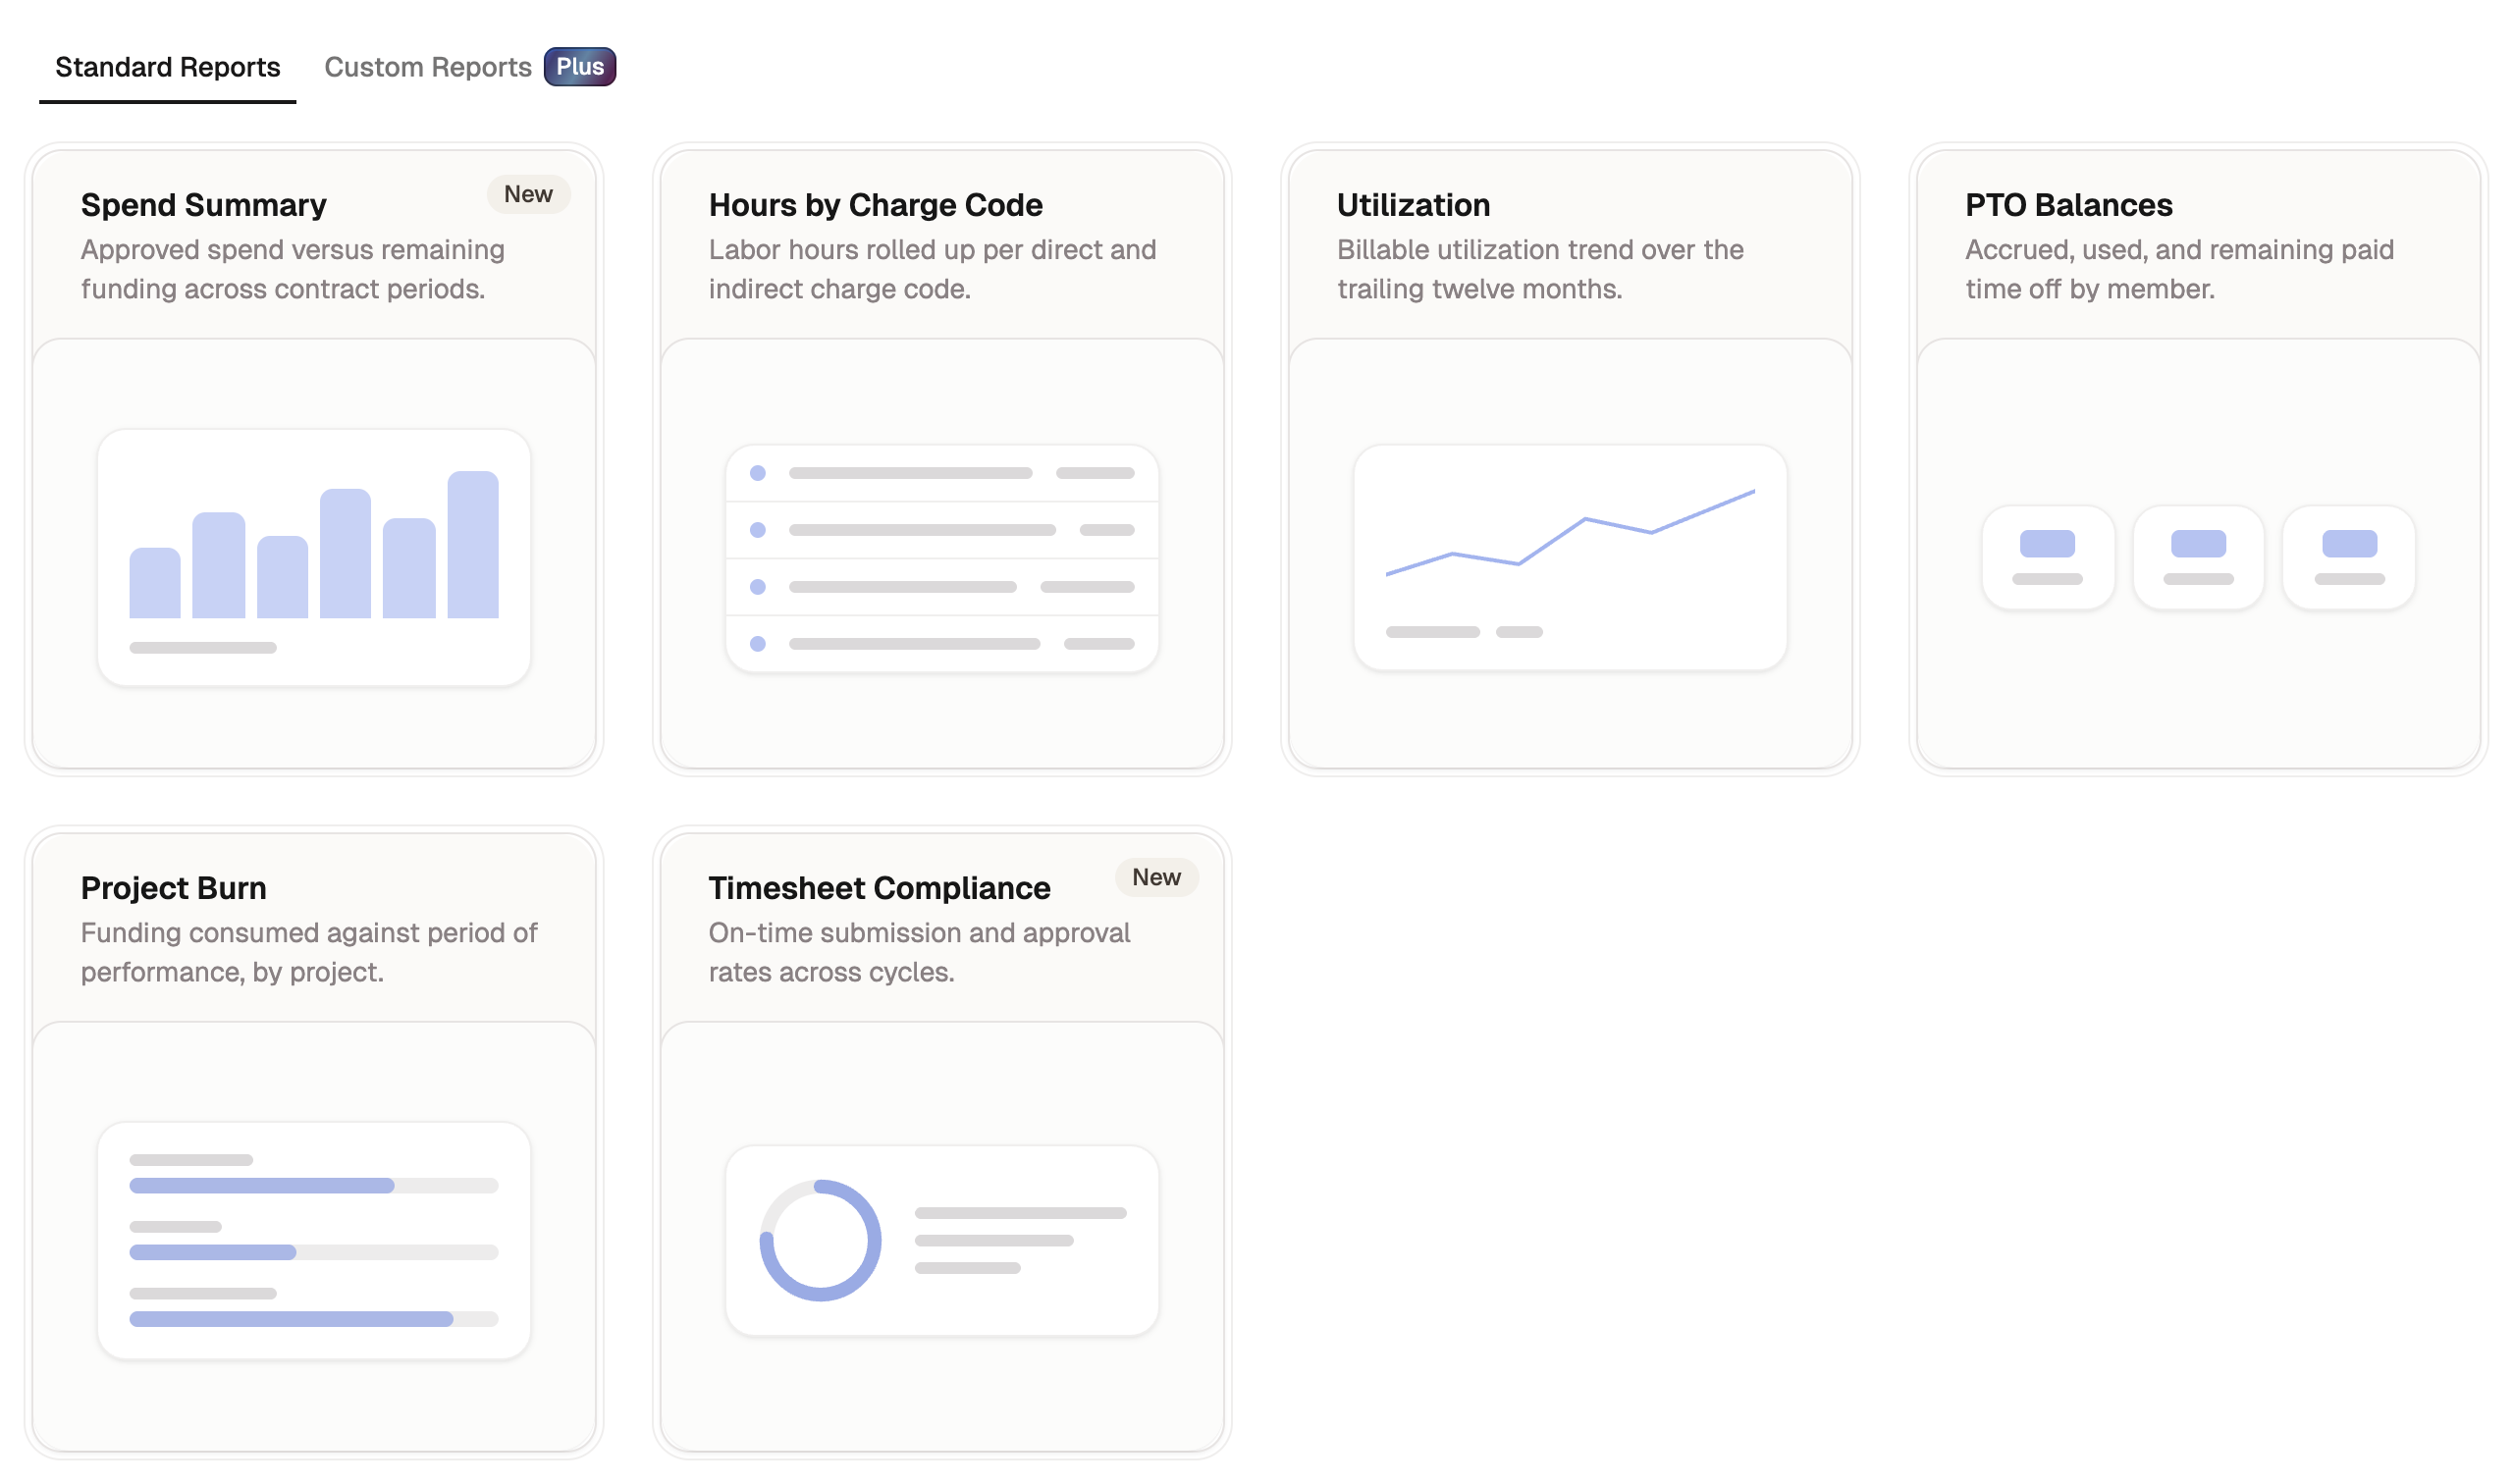
Standard and custom reports
The hub has two tabs:
- Standard Reports: six ready-made reports that need no setup. Available on every plan.
- Custom Reports: build your own. Available on the Plus plan. A custom report is either a chart report or a table report.
Move through a period
A report opens on its most recent complete window. Where a report covers one period or year at a time, step through it without leaving the page:
- For period-based reports, use the Previous period and Next period arrows beside the period label.
- For year-based reports, such as a Member leave balances custom report, use the year picker to step between calendar years.
Periods follow the pay-period cadence you set for your organization, so the buckets you compare match how your team actually keeps time.
Set a date range
The period and year arrows move one window at a time. For an exact span instead, most reports take a date range. Select Choose date range in the report header to open the picker:
- Pick a preset: This month, Last 30 days, This quarter, Last quarter, Last 90 days, Year to date, or Last 12 months.
- Or set your own start and end on the two-month calendar. A range can span up to 36 months.
A date range replaces the report's default window. Select Reset to clear it and return to that window.
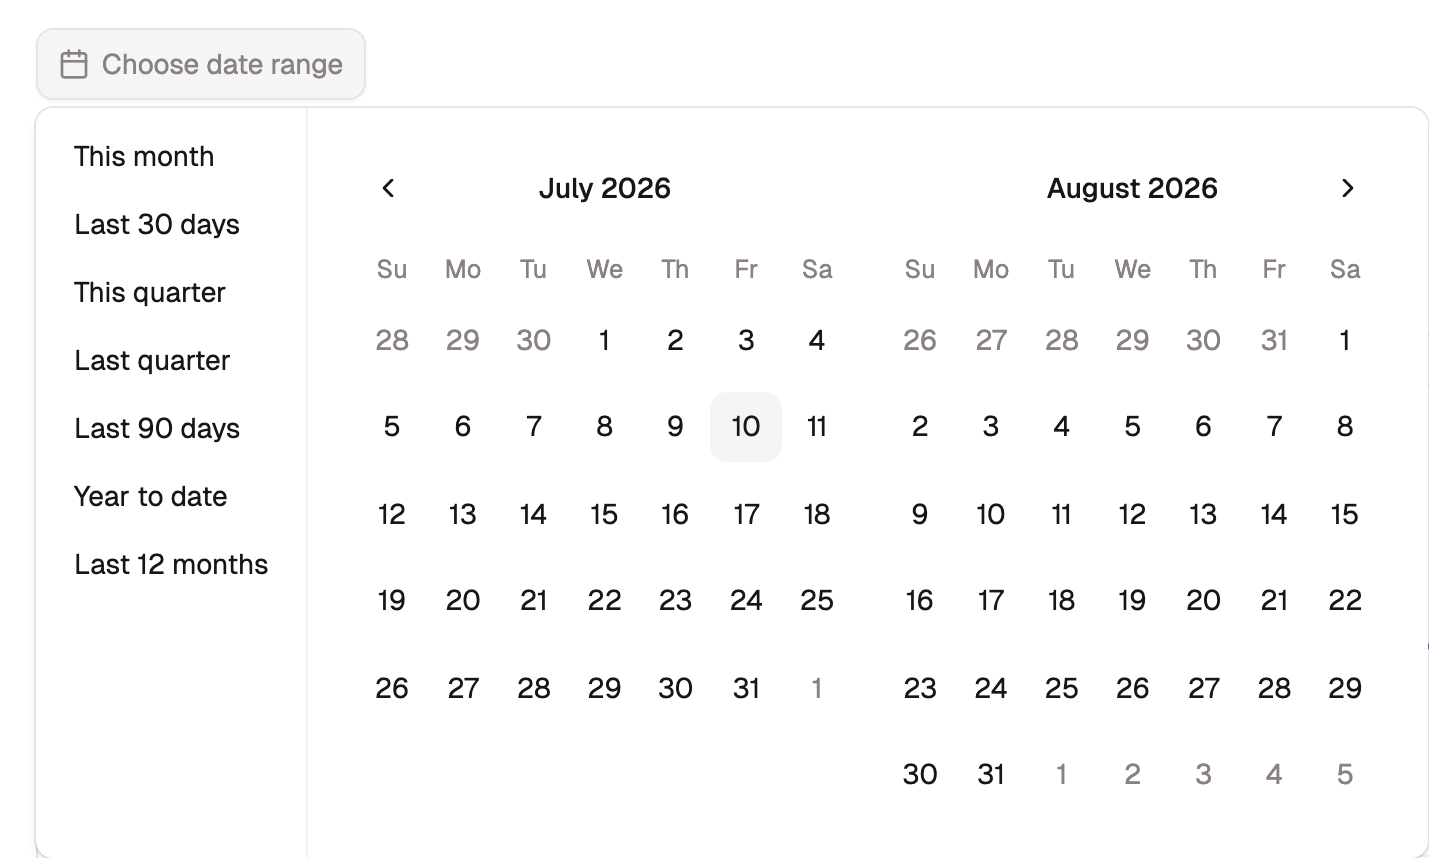
How a range lands depends on the report:
- Reports built from daily entries, such as Hours by Member and Spend summary, cover exactly the days you chose, so the first and last periods can show partial figures. Leave balance roll-forward works in days too, since a month end or a check date rarely falls on a period boundary.
- Reports built on whole periods, such as Utilization and Timesheet compliance, widen to every period your range touches, so a rate is never measured against half a period. The report says so on the page, naming the range you asked for beside the full periods it actually shows.
Not every report takes a range. Project burn always shows each funded project's full period of performance; see Standard reports.
Two more things shape what a range returns:
- Once a cycle is no longer open, a report counts its approved hours only. That's deliberate: a closed period is a record, not a work in progress. It also means a month's pull can come in lower than the raw hours your team logged; the report notes when this is why. Draft and submitted hours still count while their cycle is open.
- A range that reaches into the past is divided using the timesheet schedule your organization ran at the time. If you've since changed cadence, old periods keep their original shape.
Export a report
Every report exports to a spreadsheet for sharing or deeper analysis.
- Open the report you want.
- Select Export.
- Choose Export as CSV or Export as Excel.

Export needs a paid plan. Starter and Plus both include CSV and Excel. On the free tier the Export button stays disabled.