
Table reports
Build a reusable export table, pick and reorder columns, filter, and download as CSV or Excel.
A table report is a saved, reusable export. You pick the columns, the time scope (billing cycles or a date range), and the filters; the report renders on screen and downloads as CSV or Excel. It's the right choice when you want raw rows to hand off or analyze, rather than a chart.
Create a table report
- Open Reports and select the Custom Reports tab.
- Select Create a new report, the dashed tile at the end of the grid.
- Choose Table report.
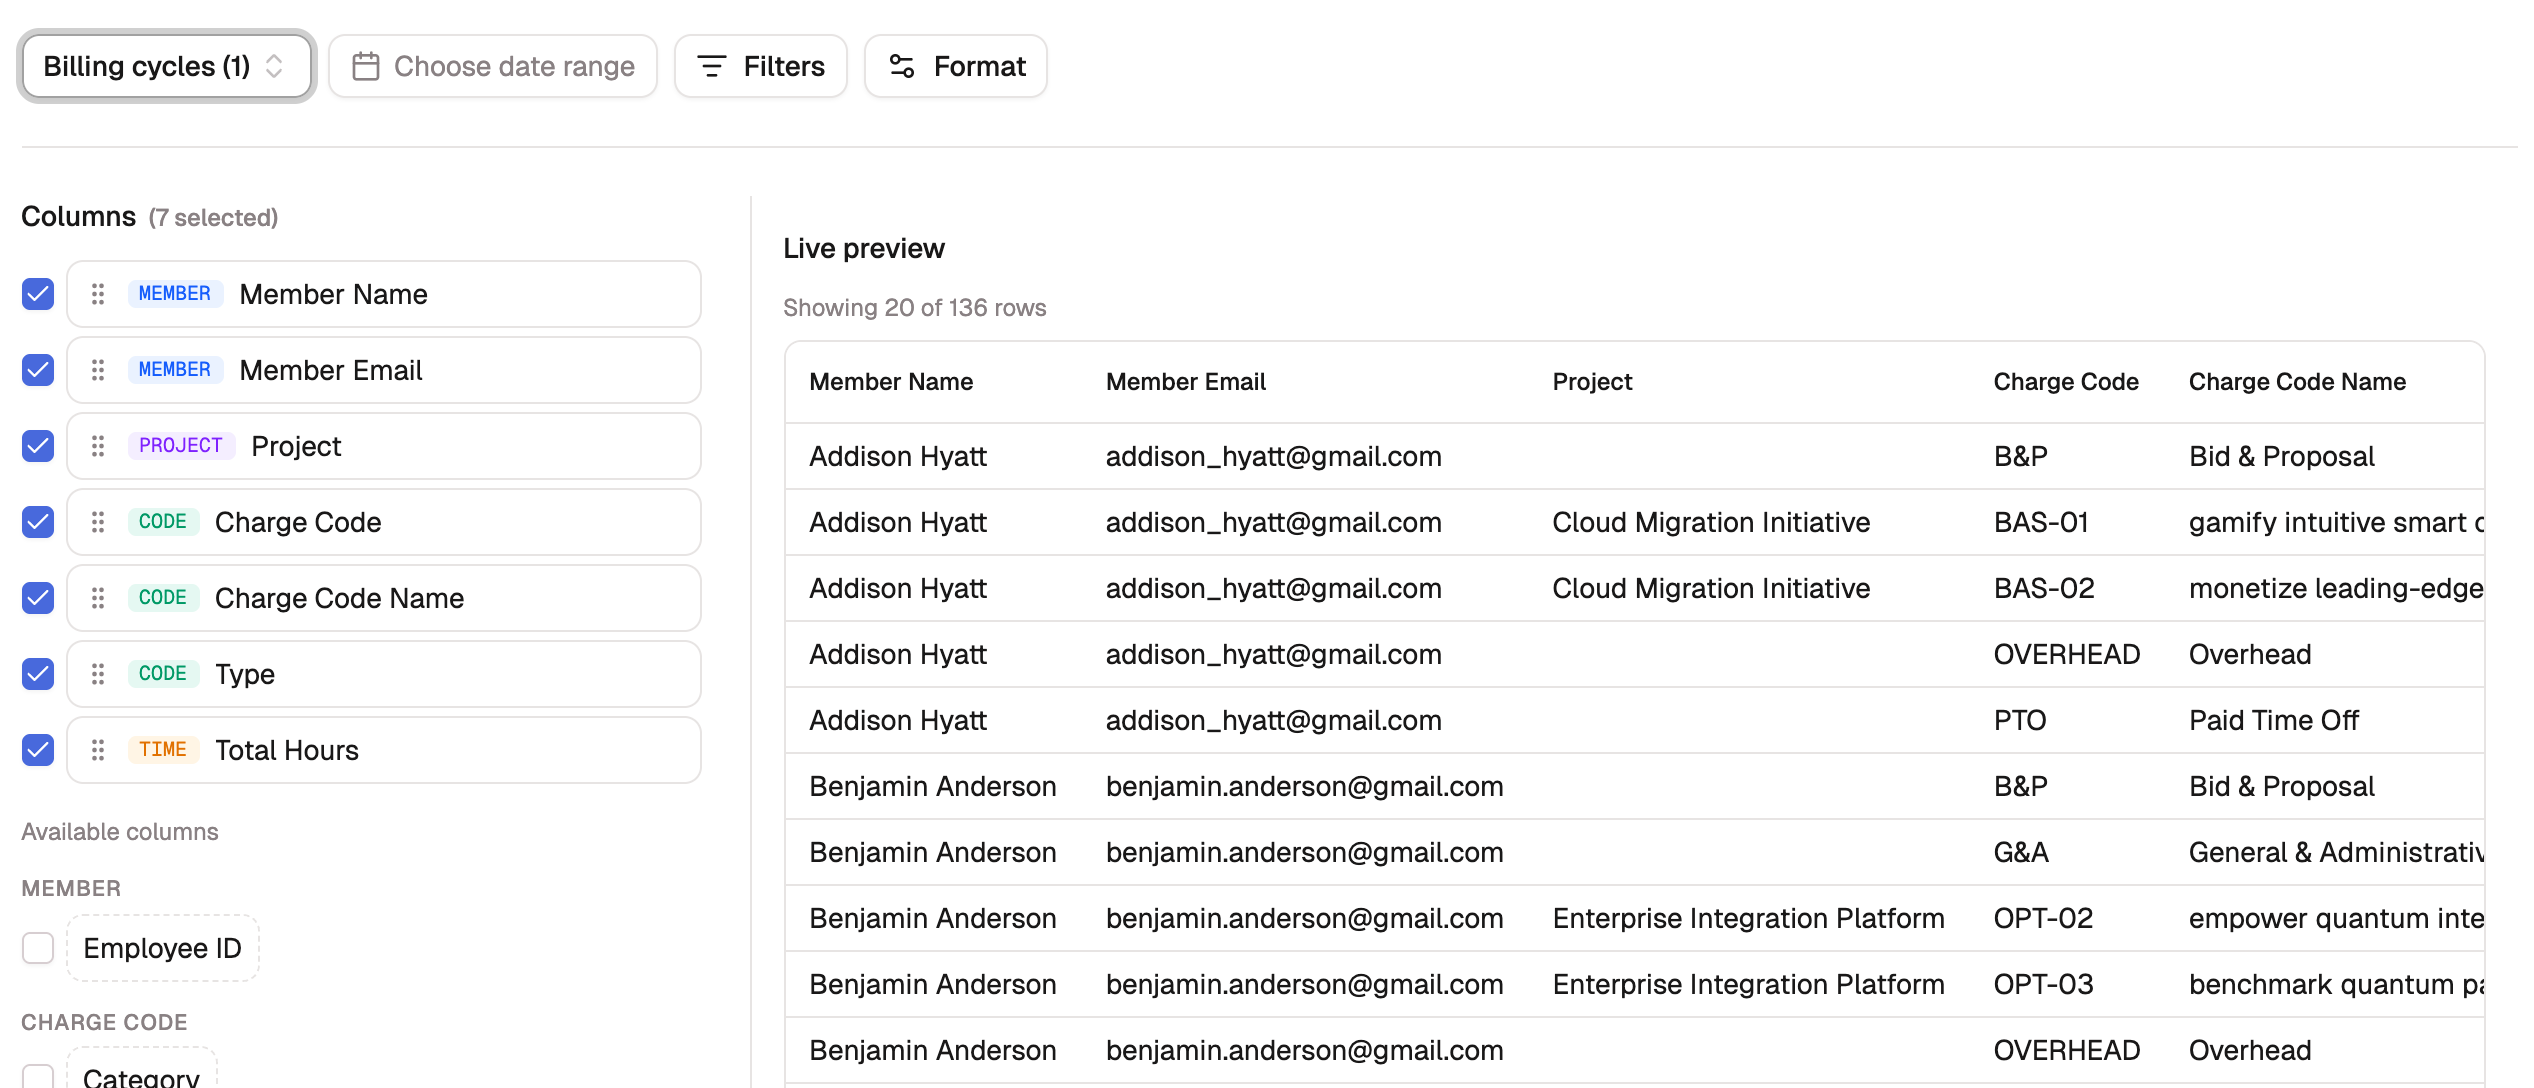
The builder opens with a column panel on the left, a live preview on the right, and a toolbar for the time scope, filters, and format across the top.
Choose your columns
The Columns panel lists what's in the table, in order. Available columns below it are grouped by category. Build the table by hand:
- Add a column: select its checkbox under Available columns.
- Reorder: drag a selected column up or down. Columns export in the order shown here.
- Rename: edit a column's label to change its header without changing the data.
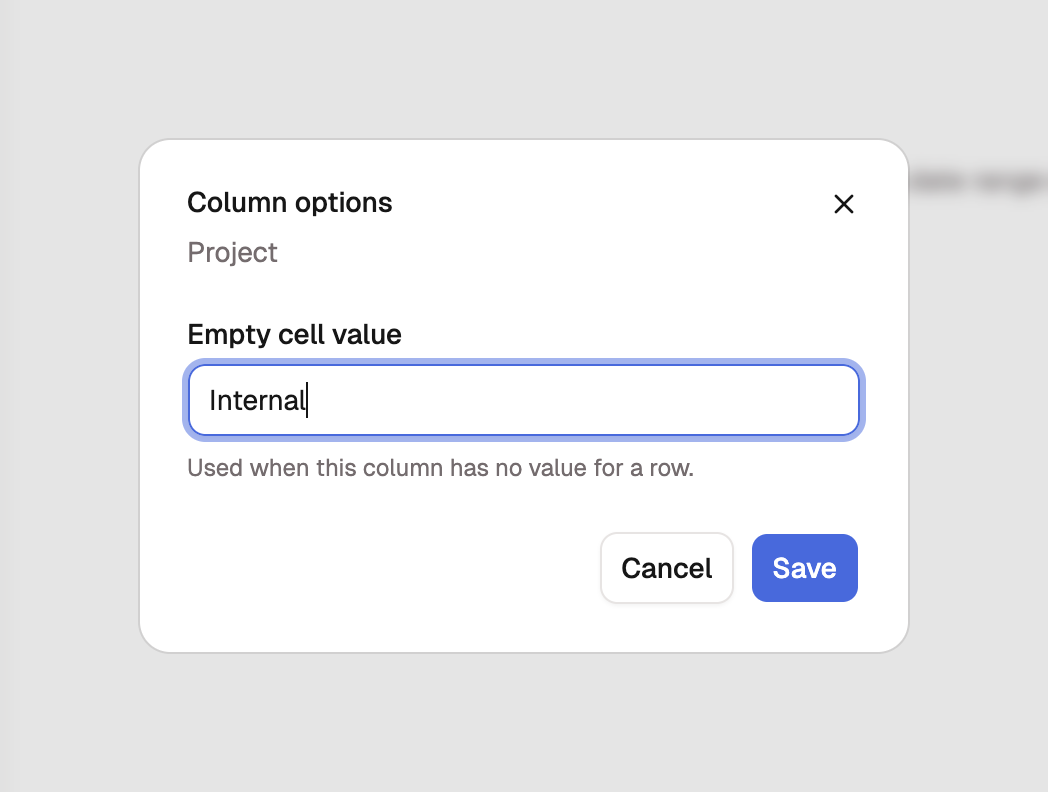
- Fill blanks: hover a column and select the Column options cog, then enter
an Empty cell value. The value stands in wherever that column has no data, in
the preview and both export formats. Set Project to
Internal, for example, and indirect hours (PTO, overhead, G&A) export with a project on every line — something accounting imports often require.
The columns you can pick fall into these groups:
| Group | Columns |
|---|---|
| Member | Member Name, Member Email, Employee ID |
| Charge Code | Charge Code, Charge Code Name, Type, Category, CLIN |
| Project | Project, Contract Period |
| Time | Total Hours, Date, Hours, Entry Type, Description, Daily Hours |
| Audit | Status, Submitted At, Approved At, Approved By |
| Custom Fields | One column per member or charge code custom field you've defined |
How your columns shape the table
You don't pick a table style. The shape follows from the columns you choose, and the three shapes don't mix:
- A summary table totals hours per row. Use Total Hours with member, charge code, or project columns to roll everything up.
- An entry-level table lists one row per time entry. The columns marked per entry (such as Date, Hours, Entry Type, Description, and the audit columns) pull this detail.
- A daily grid spreads hours across one column per calendar day. Add Daily Hours for this.
Daily Hours covers one cycle
Daily Hours builds a column for every day, so it works with a single billing cycle only. While it's in the table, cycles that would span more than one are disabled and the date range is turned off. Remove Daily Hours to select a wider range.
Scope the time range
Scope the report by billing cycles or by an exact date range. The two are separate controls in the toolbar, and you use one or the other.
Select Billing cycles to scope by cycle:
- Dynamic options track time as it moves, so the report always shows the latest data. Pick one, like Current or Last 3 cycles.
- Billing cycles lists your past cycles by name. Choose one or more specific cycles instead.
A dynamic option and specific cycles are mutually exclusive, so picking one clears the other.
Or select Choose date range for an exact span, with the same presets and calendar as the rest of Reports. See Set a date range.
Cycles and a date range are an either/or too: setting a range clears your selected cycles, and picking cycles clears the range. The preview stays empty until you set one or the other.
Filter the rows
Select Filters to narrow what's included:
- Charge Code Type: Direct or Indirect.
- Timesheet Status: Draft, Submitted, Reviewed, Approved, Rejected, or Edit Unlocked.
Leave a filter empty to include everything in that category.
Choose the export format
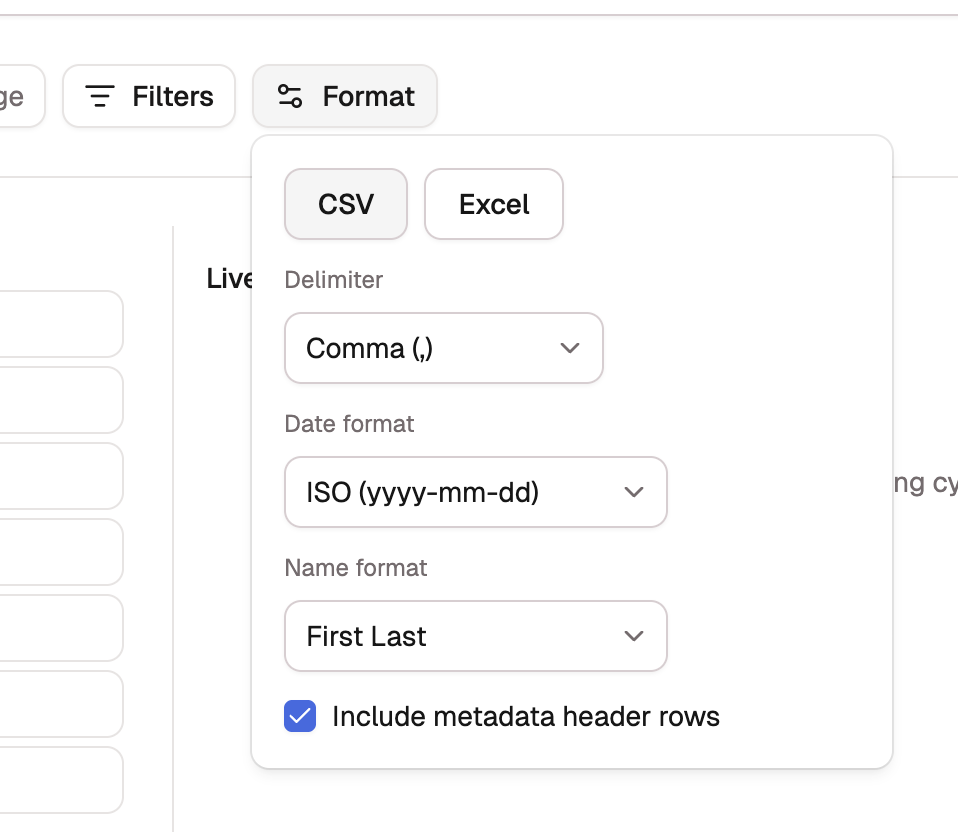
Select Format to set how the file downloads:
- CSV: choose the Delimiter (Comma, Tab, or Semicolon).
- Excel: turn on Multi-sheet workbook to split rows across sheets, then choose Group sheets by (Direct / Indirect or Project). Include metadata header rows adds the report's time scope and filters at the top of the file.
- Date format: ISO (yyyy-mm-dd), the default, or US (mm/dd/yyyy). Applies to the entry-level Date column, so an accounting system that expects US dates can take the file as-is.
- Name format: First Last, the default, or Last, First. Applies to the Member and Approved By columns, and rows sort to match, so a Last, First table reads in last-name order.
A saved report keeps the formats it was built with until you edit it, so a new default never silently rewrites an old export.
Rows without a project
A missing project exports as a blank cell (fill it with an Empty cell value if your import needs one). The one exception: grouping sheets by Project labels the sheet for those rows No Project, because Excel doesn't allow an empty tab name.
Preview, name, and save
The Live preview shows up to 20 rows and updates as you change columns, cycles, filters, or format, so you can confirm the shape before saving.
- Enter a Report name.
- Add an optional Description.
- Select Create report.
A table report saves ready to run, so there's no separate draft step. The report opens to its viewer and joins the grid on the Custom Reports tab, shared across your organization.
View and export your table
The viewer shows the full table, not the 20-row preview, with a row count and the report's time scope at the top: its billing cycles as badges, or the date range you set. Blank cells read as a dash, unless the column has an Empty cell value set; then the substitute shows instead.
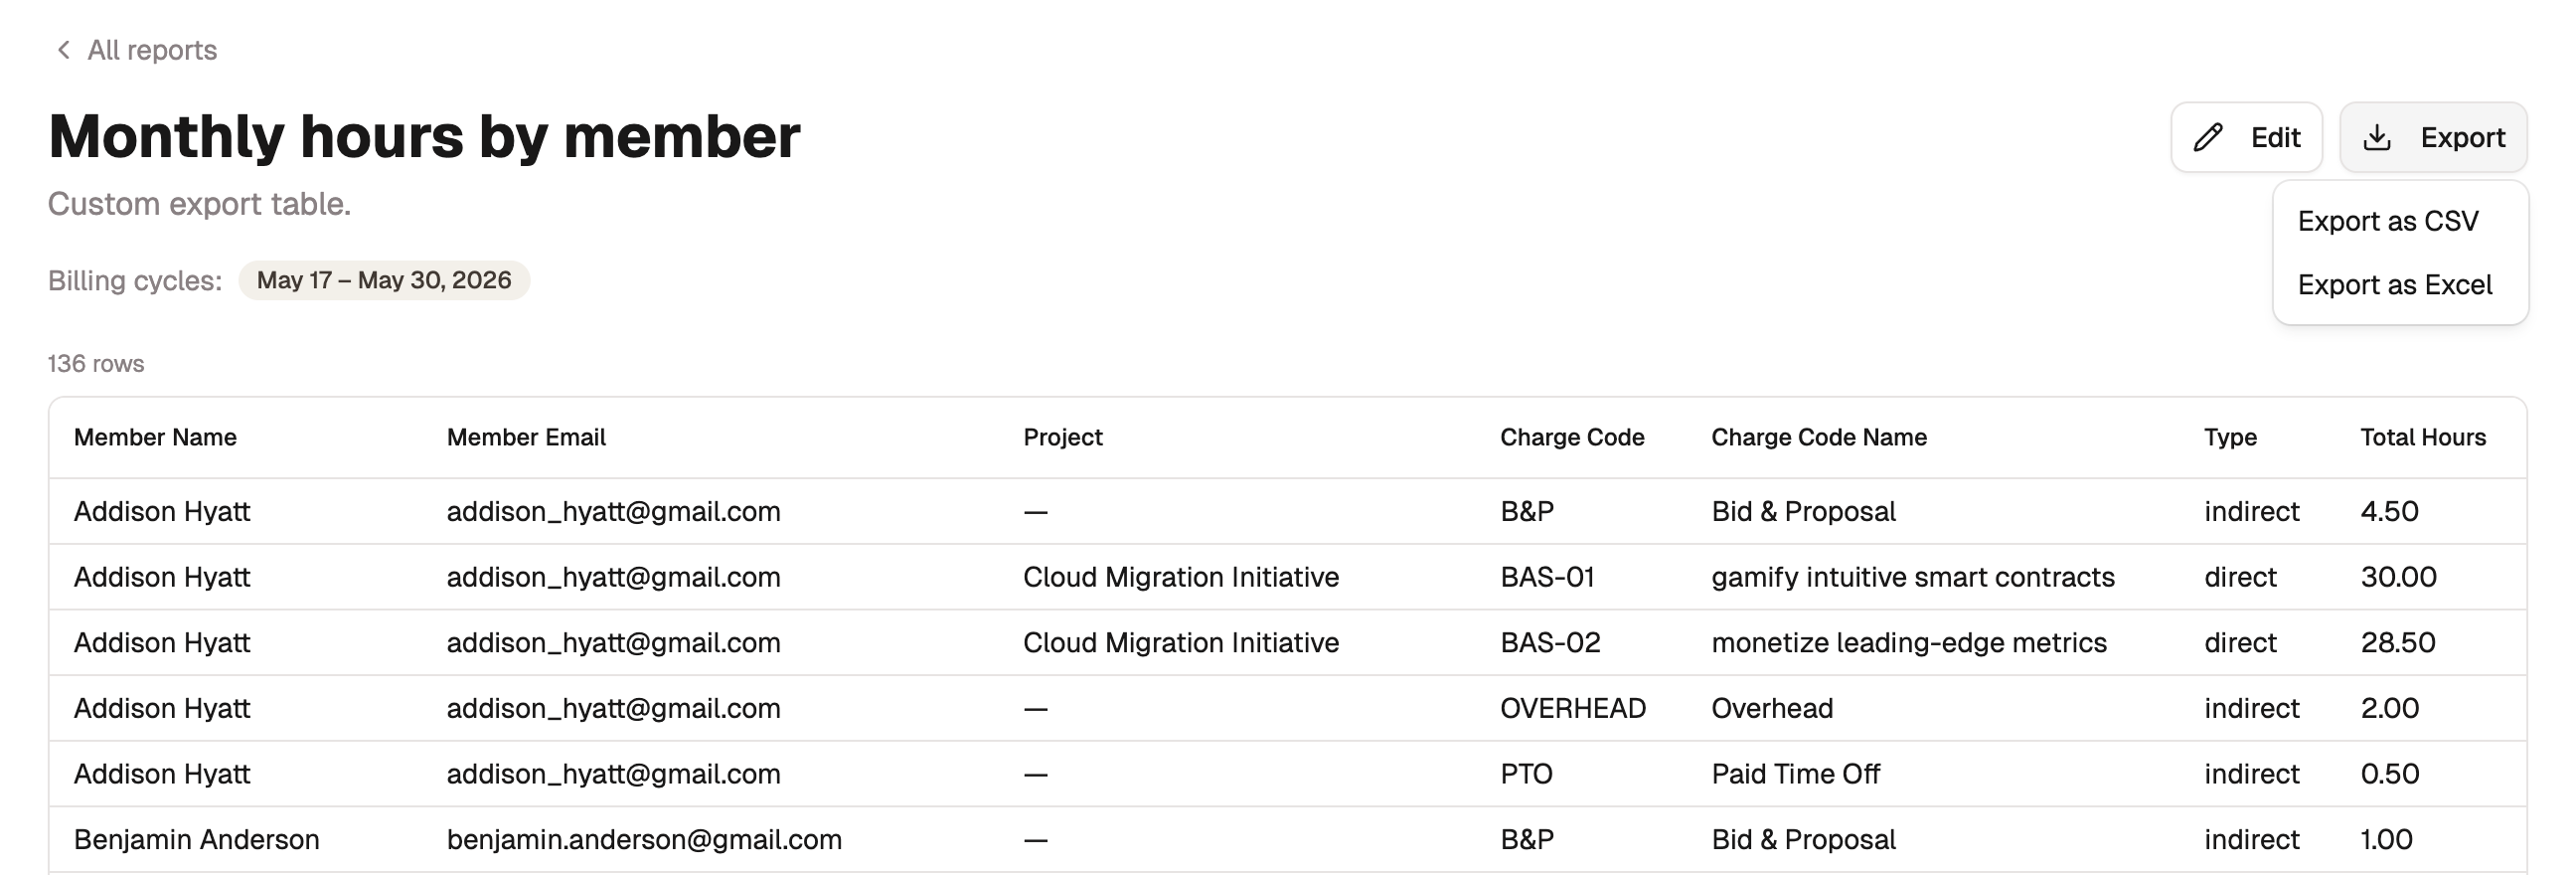
- Export: select Export, then Export as CSV or Export as Excel.
- Edit: select Edit to change columns, cycles, filters, or format, then Save report.
- All reports: return to the Custom Reports grid.
Two states tell you when there's nothing to show, each with its fix:
- No data for this report yet means no timesheet rows matched the time scope and filters. Widen the range or relax a filter, or wait for the time to be recorded.
- This table report needs reconfiguring means the saved configuration can no longer be read. Select Edit to rebuild its columns and time scope.